

Answered step by step
Verified Expert Solution
Question
1 Approved Answer
Use tiles to create the 2 plots in this problem. Let the vector scores = [ 5 0 , 6 8 , 8 3 ,
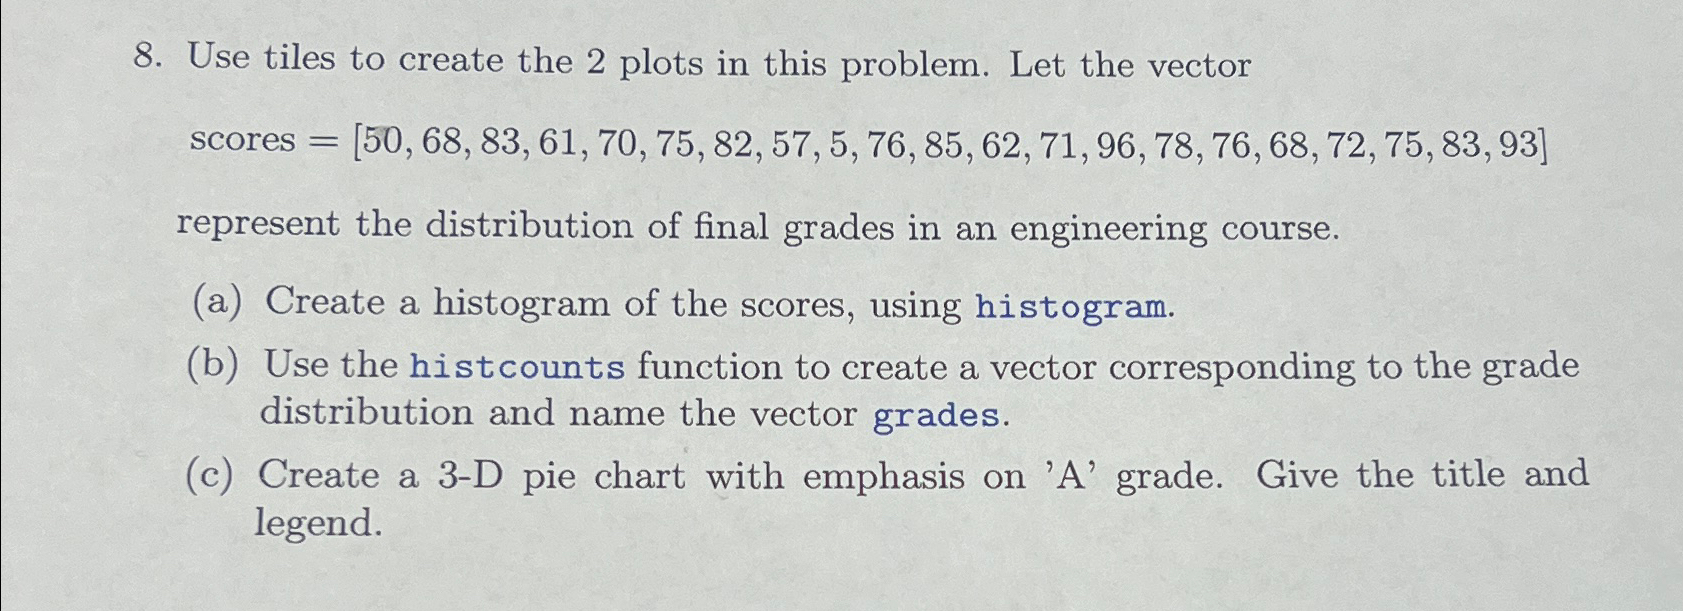
Use tiles to create the plots in this problem. Let the vector
scores
represent the distribution of final grades in an engineering course.
a Create a histogram of the scores, using histogram.
b Use the histcounts function to create a vector corresponding to the grade distribution and name the vector grades.
c Create a D pie chart with emphasis on A grade. Give the title and legend.
Step by Step Solution
There are 3 Steps involved in it
Step: 1

Get Instant Access to Expert-Tailored Solutions
See step-by-step solutions with expert insights and AI powered tools for academic success
Step: 2

Step: 3
Ace Your Homework with AI
Get the answers you need in no time with our AI-driven, step-by-step assistance
Get Started
Advanced Data Management For Sql Nosql Cloud And Distributed Databases
Authors: Lena Wiese
1st Edition
9783110441406