Question
USI has long planned to expand its sales activity in Australia. While Kanga has exclusive distribution rights in the Australian state of New South Wales,
USI has long planned to expand its sales activity in Australia. While Kanga has exclusive distribution rights in the Australian state of New South Wales, USI plans to set up operations in Brisbane, to expand into Queensland. They set-up an Australian subsidiary, USI Australia, to handle Queensland sales.
The average sales revenue breakdown based on USIs MSRPs (Manufacturers suggested retail price) is as follows: Retailer, 32%; Distributor 7%, USI, 61%. A product with a MSRP of $AUD of $160 would result in a profit margin to the retailer of $AUD51.20; to the distributor a profit margin of $AUD11.20; and Net sales to USI of $AUD97.60. Setting up their own distribution system will involve costs, but Australian revenues allocated to USI will increase by approximately 11.5% (11.20 / 97.60).
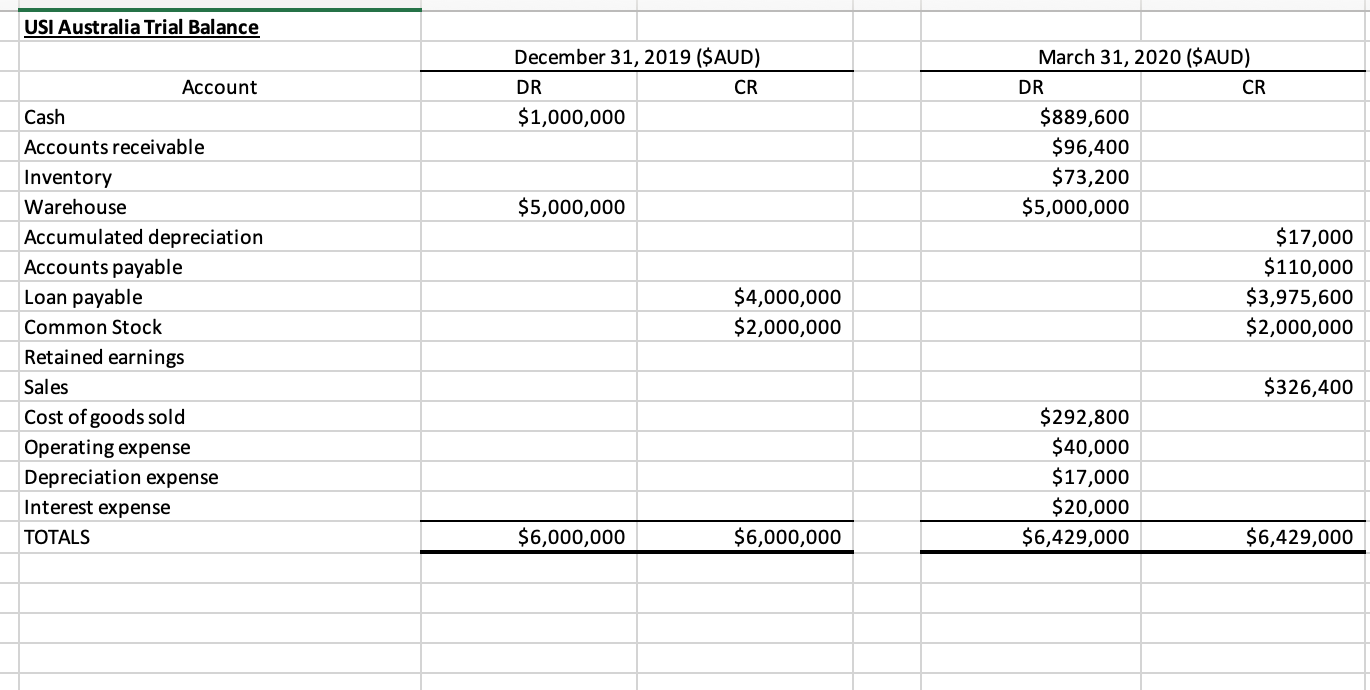
USI invests $AUD 2,000,000 ($US 1,398,780) in USI Australia on December 31, 2019. USI Australia borrows $AUD 4,000,000 and purchases a Brisbane warehouse for $AUD 5,000,000. USI Australias December 31, 2019 trial balance is in the attached excel file.
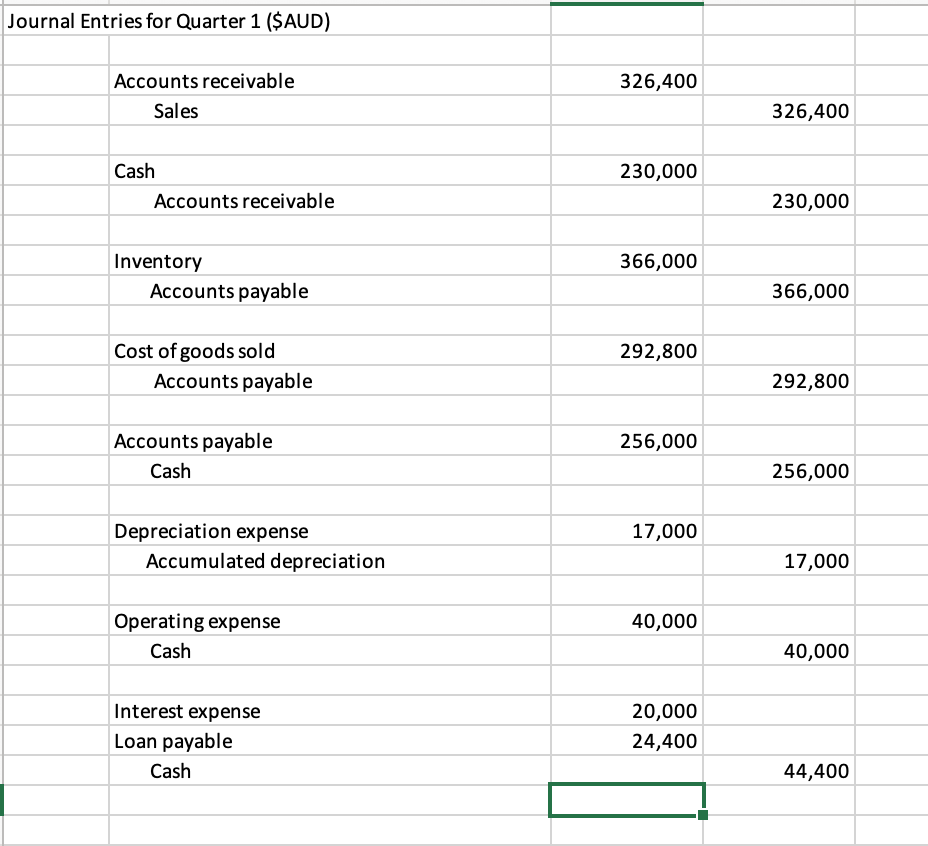
For the first quarter of 2020, USI Australia engages in a series of transactions. The journal entries for these transactions and the March 31, 2020 trial balance are also included in the attached excel file.
In accordance with US GAAP, USI designates the functional currency for USI Australia to be the $US.


Required:
- What evidence does USI use to support the choice of the $US as the functional currency? Cite the Accounting Standards Codification to support your response. What are the accounting implications of this choice?
- Prepare the remeasured financial statements for USI Australia in $US as at December 31, 2019 and March 31, 2020 (round all numbers to the nearest dollar). What is the remeasurement gain/loss for the quarter ended March 31, 2020? The exchange rates are provided in the excel file for part 1:
- 12/31/2019 0.69939
- 3/31/2020 0.59877
- Average for Quarter 1 2020 0.65687
- Average for March 2020 0.62784
The average exchange rate for quarter 1 is computed by summing the exchange rates for 12/31/19, 1/31/20, 1/28/20, and 3/31/20, and dividing the sum by 4. The average exchange rate for March is the sum of the 2/28/20 and 3/31/20 rates and dividing by 2.
Using the remeasurement approach inventory is recorded at cost (use historical rates). Inventory is assumed to be purchased during the prior month, so the March average rate is used as the historical rate for inventory on hand at 3/31/20. (See footnote 10, page 554, textbook).
- Assume that USI had designated the $AUD as the functional currency. What is the cumulative translation adjustment for the quarter ended March 31, 2020? Why is the amount different from the remeasurement gain/loss from part 2?
Step by Step Solution
There are 3 Steps involved in it
Step: 1

Get Instant Access to Expert-Tailored Solutions
See step-by-step solutions with expert insights and AI powered tools for academic success
Step: 2

Step: 3

Ace Your Homework with AI
Get the answers you need in no time with our AI-driven, step-by-step assistance
Get Started


