

Question
Using above statements please solve as much as you can questions given below. I will up-vote you for life-time. For further details on this topic,
Using above statements please solve as much as you can questions given below. I will up-vote you for life-time.

For further details on this topic, search online for Gulf International Chemicals S.A.O.G (GICI) Oman
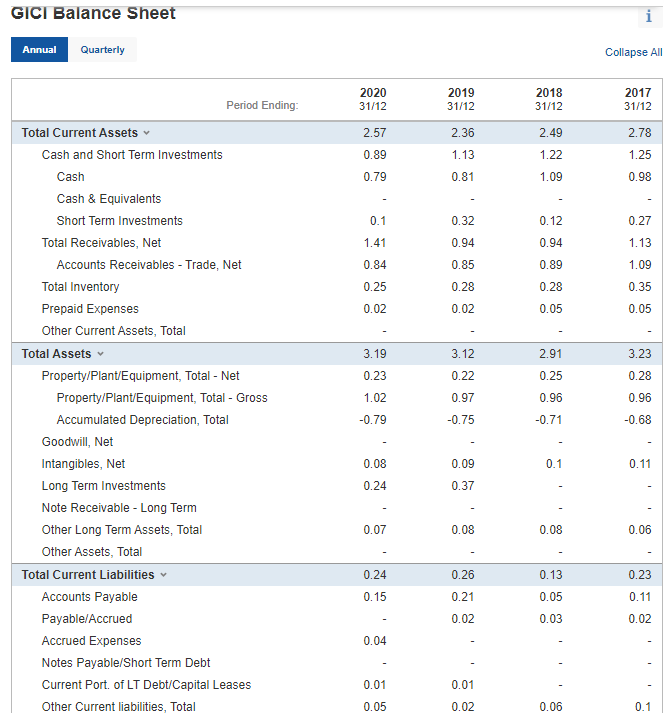
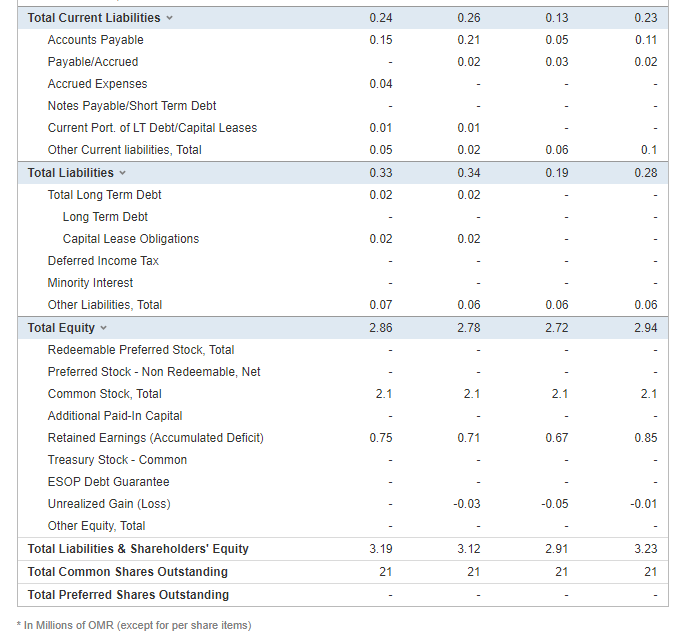
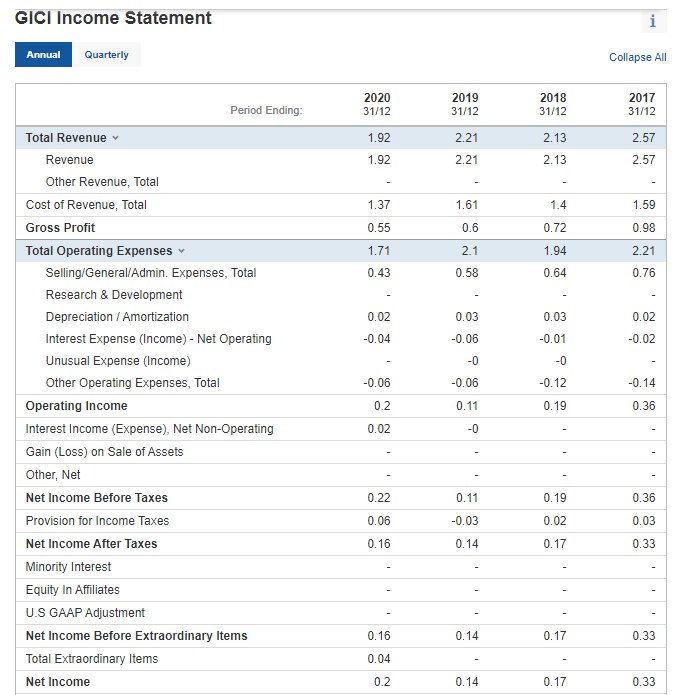
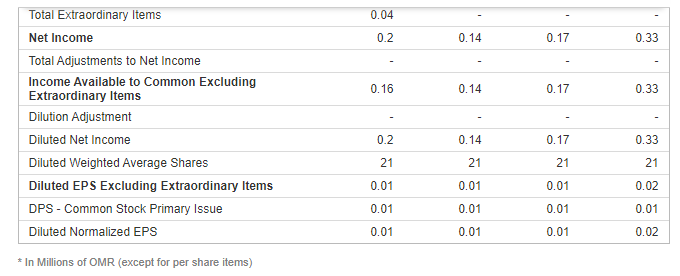
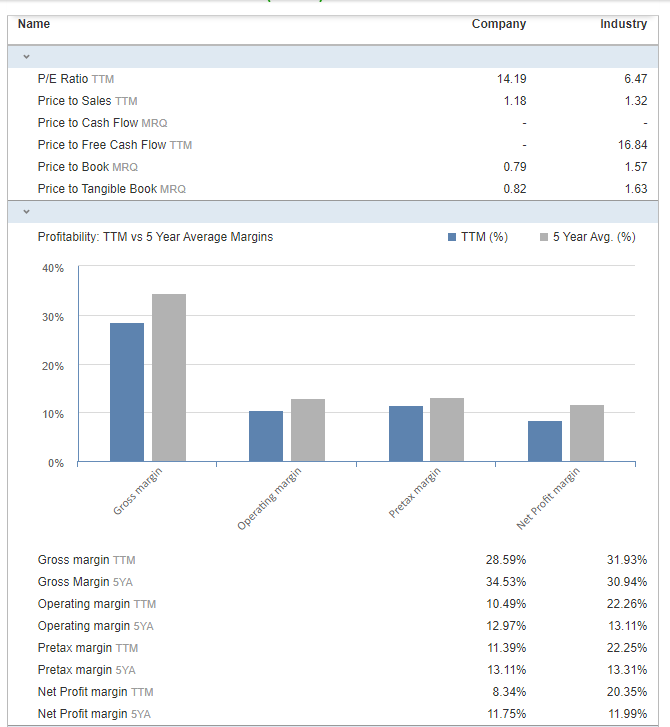
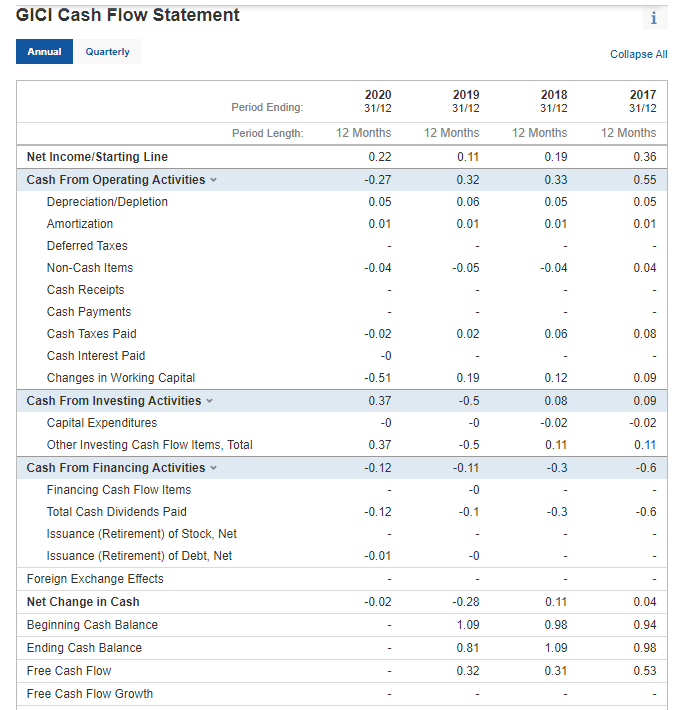
GICI Balance Sheet Annual Quarterly Collapse All Period Ending: 2020 31/12 2019 31/12 2018 31/12 2017 31/12 2.57 2.36 2.49 2.78 0.89 1.13 1.22 1.25 0.79 0.81 1.09 0.98 0.1 0.32 0.12 0.27 1.41 0.94 0.94 1.13 0.84 0.85 1.09 0.25 0.28 0.89 0.28 0.05 0.35 0.05 0.02 0.02 3.19 3.12 2.91 3.23 0.28 0.23 0.22 0.25 1.02 0.97 0.96 0.96 Total Current Assets Cash and Short Term Investments Cash Cash & Equivalents Short Term Investments Total Receivables, Net Accounts Receivables - Trade, Net Total Inventory Prepaid Expenses Other Current Assets, Total Total Assets Property/Plant/Equipment, Total - Net Property/Plant/Equipment, Total - Gross Accumulated Depreciation, Total Goodwill, Net Intangibles, Net Long Term Investments Note Receivable - Long Term Other Long Term Assets, Total Other Assets, Total Total Current Liabilities Accounts Payable Payable/Accrued Accrued Expenses Notes Payable/Short Term Debt Current Port of LT Debt/Capital Leases Other Current liabilities, Total -0.79 -0.75 -0.71 -0.68 0.08 0.09 0.1 0.11 0.24 0.37 0.07 0.08 0.08 0.06 0.24 0.26 0.13 0.05 0.23 0.11 0.15 0.21 0.02 0.03 0.02 0.04 0.01 0.01 0.05 0.02 0.06 0.1 0.24 0.26 0.13 0.23 0.15 0.21 0.05 0.11 0.02 0.03 0.02 0.04 - 0.01 0.01 0.02 0.1 0.05 0.33 0.06 0.19 0.34 0.28 0.02 0.02 0.02 0.02 Total Current Liabilities Accounts Payable Payable/Accrued Accrued Expenses Notes Payable/Short Term Debt Current Port of LT Debt/Capital Leases Other Current liabilities, Total Total Liabilities Total Long Term Debt Long Term Debt Capital Lease Obligations Deferred Income Tax Minority Interest Other Liabilities, Total Total Equity Redeemable Preferred Stock, Total Preferred Stock - Non Redeemable, Net Common Stock, Total Additional Paid-In Capital Retained Earnings (Accumulated Deficit) Treasury Stock - Common ESOP Debt Guarantee Unrealized Gain (Loss) Other Equity, Total Total Liabilities & Shareholders' Equity Total Common Shares Outstanding Total Preferred Shares Outstanding 0.07 0.06 0.06 0.06 2.86 2.78 2.72 2.94 2.1 2.1 2.1 2.1 0.71 0.85 -0.03 -0.05 -0.01 3.19 3.12 2.91 3.23 21 21 21 21 * In Millions of OMR (except for per share items) GICI Income Statement i Annual Quarterly Collapse All Period Ending 2020 31/12 2019 31/12 2018 31/12 2017 31/12 1.92 2.21 2.13 2.57 2.57 1.92 2.21 2.13 1.37 1.61 1.4 1.59 0.55 0.6 0.72 0.98 1.71 2.1 1.94 2.21 0.43 0.58 0.64 0.76 0.02 0.03 0.03 0.02 -0.02 -0.04 -0.06 -0.01 -0 -0 -0.06 -0.06 -0.12 -0.14 0.2 Total Revenue Revenue Other Revenue, Total Cost of Revenue, Total Gross Profit Total Operating Expenses Selling/General/Admin. Expenses, Total Research & Development Depreciation / Amortization Interest Expense (Income) - Net Operating Unusual Expense (Income) Other Operating Expenses, Total Operating Income Interest Income (Expense), Net Non-Operating Gain (Loss) on Sale of Assets Other, Net Net Income Before Taxes Provision for Income Taxes Net Income After Taxes Minority Interest Equity In Affiliates U.S GAAP Adjustment Net Income Before Extraordinary Items Total Extraordinary Items Net Income 0.11 0.19 0.36 0.02 -0 0.22 0.11 0.19 0.36 0.06 -0.03 0.02 0.03 0.16 0.14 0.17 0.33 0.16 0.14 0.17 0.33 0.04 0.2 0.14 0.17 0.33 0.04 0.2 0.14 0.17 0.33 0.16 0.14 0.17 0.33 Total Extraordinary Items Net Income Total Adjustments to Net Income Income Available to Common Excluding Extraordinary Items Dilution Adjustment Diluted Net Income Diluted Weighted Average Shares Diluted EPS Excluding Extraordinary Items DPS - Common Stock Primary Issue Diluted Normalized EPS 0.2 0.14 0.17 0.33 21 21 21 21 0.01 0.01 0.01 0.02 0.01 0.01 0.01 0.01 0.01 0.01 0.01 0.02 In Millions of OMR (except for per share items) Name Company Industry 14.19 1.18 6.47 1.32 P/E Ratio TTM Price to Sales TTM Price to Cash Flow MRQ Price to Free Cash Flow TTM Price to Book MRQ Price to Tangible Book MRQ 16.84 0.79 1.57 0.82 1.63 Profitability: TTM vs 5 Year Average Margins TTM (%) 5 Year Avg. (%) 40% 30% 20% 10% 0% Gross margin Pretax margin Operating margin Net Profit margin 28.59% 34.53% 10.49% Gross margin TTM Gross Margin SYA Operating margin TTM Operating margin 5YA Pretax margin TTM Pretax margin SYA Net Profit margin TTM Net Profit margin SYA 31.93% 30.94% 22.26% 13.11% 22.25% 13.31% 12.97% 11.39% 13.11% 8.34% 20.35% 11.75% 11.99% GICI Cash Flow Statement i Annual Quarterly Collapse All 2020 31/12 2019 31/12 2018 31/12 12 Months 12 Months 0.22 -0.27 2017 31/12 12 Months 0.36 0.55 0.05 12 Months 0.19 0.33 0.05 0.11 0.32 0.05 0.06 0.01 0.01 0.01 0.01 -0.04 -0.05 -0.04 0.04 -0.02 0.02 0.06 0.08 -0 -0.51 0.19 Period Ending: Period Length: Net Income/Starting Line Cash From Operating Activities Depreciation/Depletion Amortization Deferred Taxes Non-Cash Items Cash Receipts Cash Payments Cash Taxes Paid Cash Interest Paid Changes in Working Capital Cash From Investing Activities Capital Expenditures Other Investing Cash Flow Items, Total Cash From Financing Activities Financing Cash Flow Items Total Cash Dividends Paid Issuance (Retirement) of Stock, Net Issuance (Retirement) of Debt, Net Foreign Exchange Effects Net Change in Cash Beginning Cash Balance Ending Cash Balance Free Cash Flow 0.37 -0.5 0.12 0.08 -0.02 0.11 0.09 0.09 -0.02 0.11 -0 -0 0.37 -0.5 -0.12 -0.11 -0.3 -0.6 -0 - -0.12 -0.1 -0.3 -0.6 -0.01 -0 -0.02 -0.28 0.11 0.04 1.09 0.98 0.94 0.81 1.09 0.98 0.32 0.31 0.53 Free Cash Flow Growth - 6. Profitability Analysis: a. ROA. b. Profit Margin. Assets Turnover. 7. ROCE Analysis a. ROCE. b. CEL. C. CSL. 9. Long-Term Solvency Risk-Debt Ratios: a. L.T. Debt Ratio. b. Debt/Equity Ratio. c. L.T. Debt/Asset Ratio. 10. Multiple Discriminant Analysis: a. Altman's Z-ScoreStep by Step Solution
There are 3 Steps involved in it
Step: 1

Get Instant Access to Expert-Tailored Solutions
See step-by-step solutions with expert insights and AI powered tools for academic success
Step: 2

Step: 3
Ace Your Homework with AI
Get the answers you need in no time with our AI-driven, step-by-step assistance
Get Started
Think Like A Millionaire Auditor How To Build Practical Efficiency Increase Revenue And Experience Peace Of Mind That Will Transform Your Business Leadership And Life
Authors: Michael J. Harrison
1st Edition
B0B6XJBHR7, 979-8838447821