Answered step by step
Verified Expert Solution
Question
1 Approved Answer
Using C++ A popular method of displaying data is in a Histogram. A histogram counts how many items of data fall in each of n
Using C++
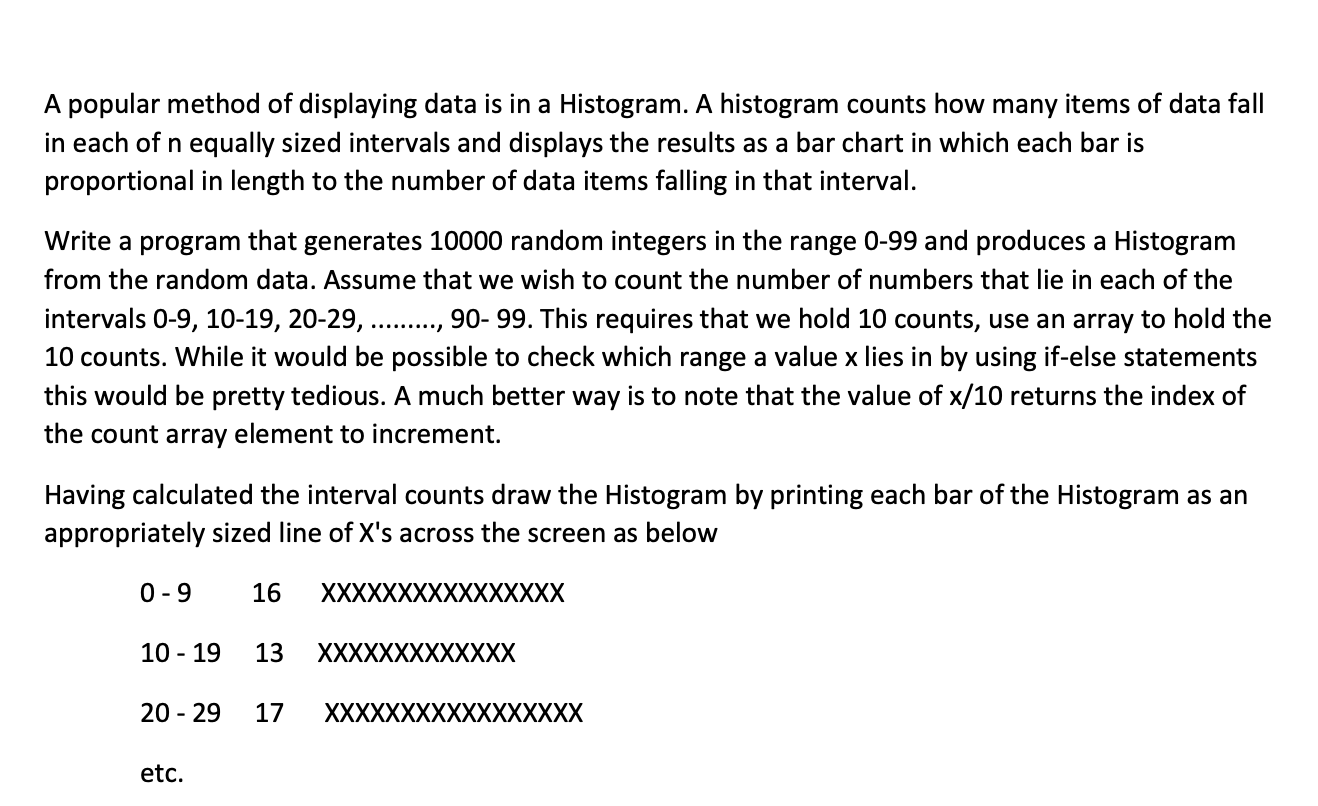
A popular method of displaying data is in a Histogram. A histogram counts how many items of data fall in each of n equally sized intervals and displays the results as a bar chart in which each bar is proportional in length to the number of data items falling in that interval. Write a program that generates 10000 random integers in the range 0-99 and produces a Histogram from the random data. Assume that we wish to count the number of numbers that lie in each of the intervals 0-9, 10-19, 20-29, . 90- 99. This requires that we hold 10 counts, use an array to hold the ........, 10 counts. While it would be possible to check which range a value x lies in by using if-else statements this would be pretty tedious. A much better way is to note that the value of x/10 returns the index of the count array element to increment. Having calculated the interval counts draw the Histogram by printing each bar of the Histogram as an appropriately sized line of X's across the screen as below 0 - 9 16 XXXXXXXXXXXXXXXX 10 - 19 XXXXXXXXXXXXX 13 20 - 29 XXXXXXXXXXXXXXXXX 17 etcStep by Step Solution
There are 3 Steps involved in it
Step: 1
Get Instant Access to Expert-Tailored Solutions
See step-by-step solutions with expert insights and AI powered tools for academic success
Step: 2
Step: 3
Ace Your Homework with AI
Get the answers you need in no time with our AI-driven, step-by-step assistance
Get Started