

Answered step by step
Verified Expert Solution
Question
1 Approved Answer
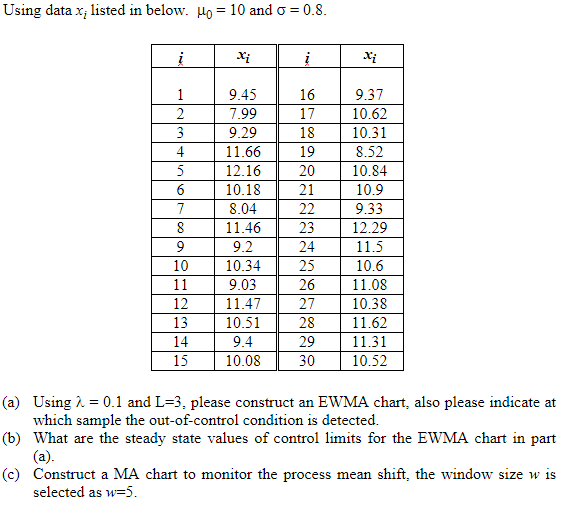
Using data x, listed in below. Jo = 10 and 6 = 0.8. Xi Xi 9.45 16 9.37 7.99 17 10.62 9.29 18 10.31 11.66
Step by Step Solution
There are 3 Steps involved in it
Step: 1

Get Instant Access to Expert-Tailored Solutions
See step-by-step solutions with expert insights and AI powered tools for academic success
Step: 2

Step: 3
Ace Your Homework with AI
Get the answers you need in no time with our AI-driven, step-by-step assistance
Get Started
Calculus Early Transcendentals, Multivariable
Authors: Michael Sullivan, Kathleen Miranda
2nd Edition
131924288X, 9781319242886