

Answered step by step
Verified Expert Solution
Question
1 Approved Answer
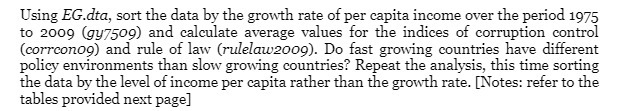
Using EG.dta, sort the data by the growth rate of per capita income over the period 1975 to 2009 (gy7509) and calculate average values for
Step by Step Solution
There are 3 Steps involved in it
Step: 1

Get Instant Access to Expert-Tailored Solutions
See step-by-step solutions with expert insights and AI powered tools for academic success
Step: 2

Step: 3
Ace Your Homework with AI
Get the answers you need in no time with our AI-driven, step-by-step assistance
Get Started
Managerial economics applications strategy and tactics
Authors: James r. mcguigan, R. Charles Moyer, frederick h. deb harris
12th Edition
9781133008071, 1439079234, 1133008070, 978-1439079232