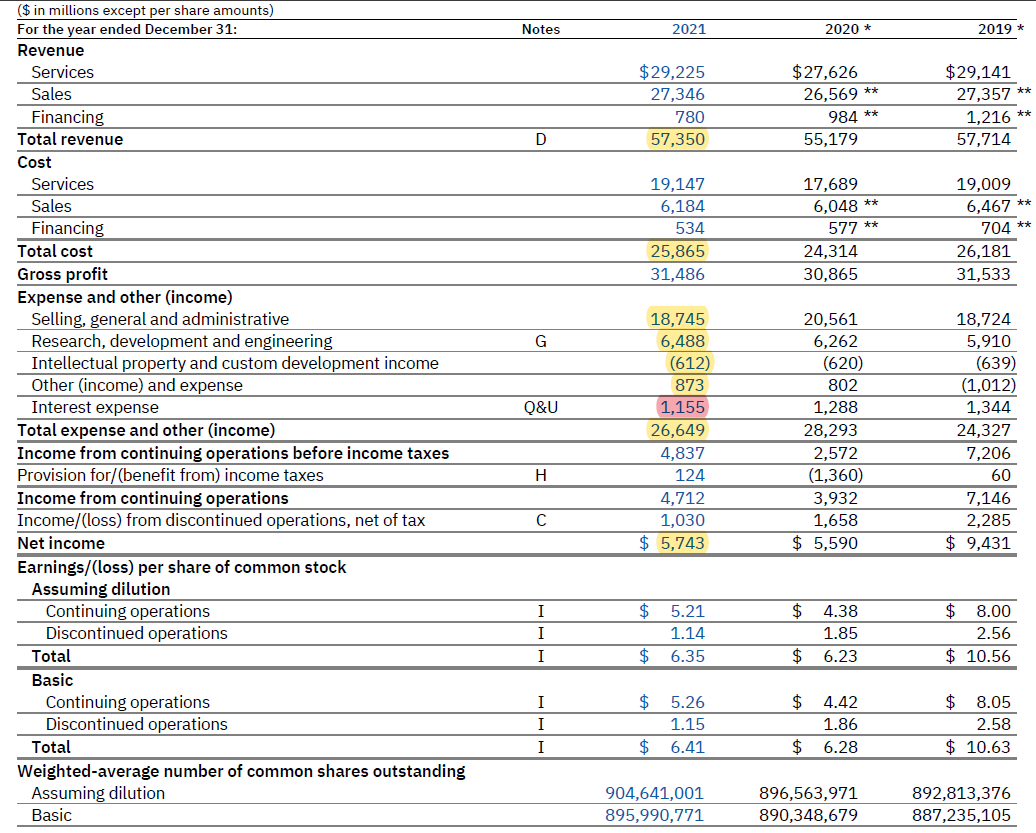
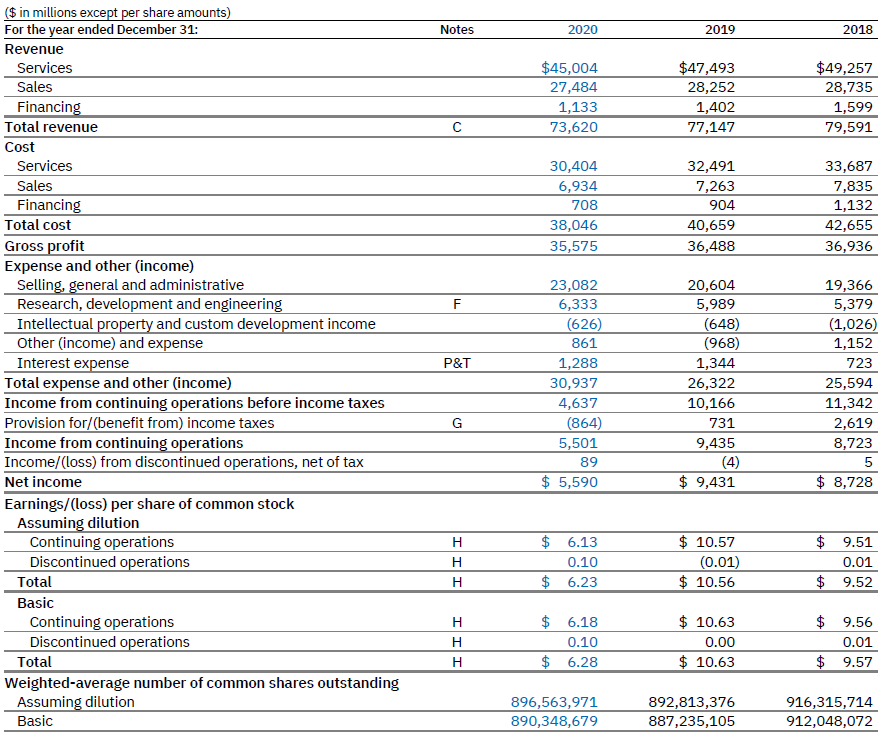
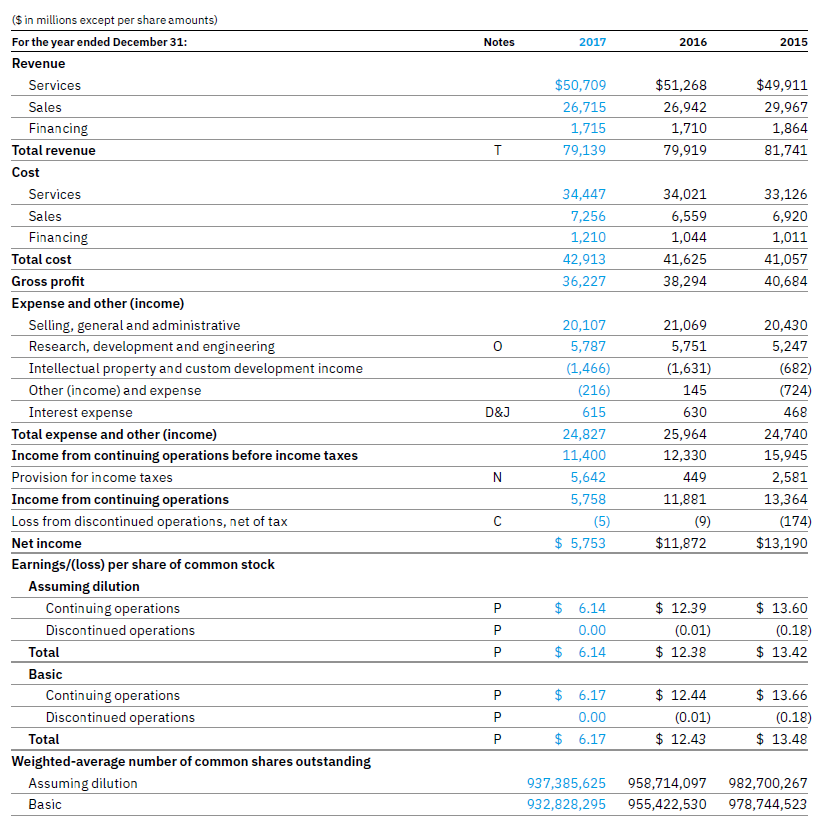
- Using excel and the financial statements of the company IBM (Provded) calculate the following ratios for the last five years and prepare a table showing these ratios.
Income Statement:


Requirements:
Liquidity Ratios
- Current Ratio
- Quick Ratio
- Cash Ratio
Long-Term Solvency Ratios
- Total debt ratio
- Debt/equity ratio
- Equity Multiplier = Assets/Equity
- Long-term Debt Equity ration
- Times Interest Earned
Assets Turnover Ratio
- Inventory Turnover
- Days sales in inventory
- Receivables turnover
- Days sales in receivables
- Total Assets turnover
Profitability Ratios
- Profit Margin
- Return on Assets
- Du Pont Identity: Net income/Sales x Sales/assets x Assets/Equity. (you already calculated the profit margin, total assets turnover, and the equity multiplier).
Explain
- What does the Du Pont identity (from point p) tell you about your company?
Notes 2021 2020 * 2019 $29,225 27,346 780 57,350 $27,626 26,569 ** 984 ** 55,179 $29,141 27,357 ** 1,216 ** 57,714 D 19,147 6,184 534 25,865 31,486 17,689 6,048 ** 577 ** 24,314 30,865 19,009 6,467 ** 704 26,181 31,533 G 20,561 6,262 (620) 802 ($ in millions except per share amounts) For the year ended December 31: Revenue Services Sales Financing Total revenue Cost Services Sales Financing Total cost Gross profit Expense and other (income) Selling, general and administrative Research, development and engineering Intellectual property and custom development income Other (income, and expense Interest expense Total expense and other (income) Income from continuing operations before income taxes Provision for/(benefit from) income taxes Income from continuing operations Income/(loss) from discontinued operations, net of tax Net income Earnings/(loss) per share of common stock Assuming dilution Continuing operations Discontinued operations Total Basic Continuing operations Discontinued operations Total Weighted average number of common shares outstanding Assuming dilution Basic Q&U 18,745 6,488 (612) 873 1,155 26,649 4,837 124 4,712 1,030 $ 5,743 18,724 5,910 (639) (1,012) 1,344 24,327 7,206 60 7,146 2,285 $ 9,431 1,288 28,293 2,572 (1,360) 3,932 1,658 $ 5,590 H . $ $ I I I 5.21 1.14 6.35 4.38 1.85 6.23 $ 8.00 2.56 $ 10.56 $ $ $ $ I I I 5.26 1.15 6.41 4.42 1.86 6.28 $ 8.05 2.58 $ 10.63 $ $ 904,641,001 895,990,771 896,563,971 890,348,679 892,813,376 887,235,105 Notes 2020 2019 2018 $45,004 27,484 1,133 73,620 $47,493 28,252 1,402 77,147 $49,257 28,735 1,599 79,591 30,404 6,934 708 38,046 35,575 32,491 7,263 904 40,659 36,488 33,687 7,835 1,132 42,655 36,936 F ($ in millions except per share amounts) For the year ended December 31: Revenue Services Sales Financing Total revenue Cost Services Sales Financing Total cost Gross profit Expense and other (income) Selling, general and administrative Research, development and engineering Intellectual property and custom development income Other (income) and expense Interest expense Total expense and other (income) Income from continuing operations before income taxes Provision for/(benefit from) income taxes Income from continuing operations Income/(Loss) from discontinued operations, net of tax Net income Earnings/(loss) per share of common stock Assuming dilution Continuing operations Discontinued operations Total Basic Continuing operations Discontinued operations Total Weighted-average number of common shares outstanding Assuming dilution Basic P&T 23,082 6,333 (626) 861 1,288 30,937 4,637 (864) 5,501 89 $ 5,590 20,604 5,989 (648) (968) 1,344 26,322 10,166 731 9,435 (4) $ 9,431 19,366 5,379 (1,026) 1,152 723 25,594 11,342 2,619 8,723 5 $ 8,728 G H H H $ 6.13 0.10 $ 6.23 $ 10.57 (0.01) $ 10.56 $ 9.51 0.01 $ 9.52 H H H $ 6.18 0.10 $ 6.28 $ 10.63 0.00 $ 10.63 $ 9.56 0.01 $ 9.57 896,563,971 890,348,679 892,813,376 887,235,105 916,315,714 912,048,072 Notes 2017 2016 2015 $50,709 26,715 1,715 79,139 $51,268 26,942 1,710 79,919 $49,911 29,967 1,864 81,741 T 34,447 7,256 1,210 42,913 36,227 34,021 6,559 1,044 41,625 38,294 33,126 6,920 1,011 41,057 40,684 ($ in millions except per share amounts) For the year ended December 31: Revenue Services Sales Financing Total revenue Cost Services Sales Financing Total cost Gross profit Expense and other income) Selling, general and administrative Research, development and engineering Intellectual property and custom development income Other (income) and expense Interest expense Total expense and other (income) Income from continuing operations before income taxes Provision for income taxes Income from continuing operations Loss from discontinued operations, net of tax Net income Earnings/(loss) per share of common stock Assuming dilution Continuing operations Discontinued operations Total Basic Continuing operations Discontinued operations Total Weighted-average number of common shares outstanding Assuming dilution Basic D&J 20,107 5,787 (1,466) (216) 615 24,827 11,400 5,642 5,758 (5) $ 5,753 21,069 5,751 (1,631) 145 630 25,964 12,330 449 11,881 (9) $11,872 20,430 5,247 (682) (724) 468 24,740 15,945 2,581 13,364 (174) $13,190 N P P $ 6.14 0.00 $ 6.14 $ 12.39 (0.01) $ 12.38 $ 13.60 (0.18) $ 13.42 P P $ 6.17 0.00 $ 6.17 $ 12.44 (0.01) $ 12.43 $ 13.66 (0.18) $ 13.48 U 937,385,625 932,828,295 958,714,097 955,422,530 982,700,267 978,744,523 Notes 2021 2020 * 2019 $29,225 27,346 780 57,350 $27,626 26,569 ** 984 ** 55,179 $29,141 27,357 ** 1,216 ** 57,714 D 19,147 6,184 534 25,865 31,486 17,689 6,048 ** 577 ** 24,314 30,865 19,009 6,467 ** 704 26,181 31,533 G 20,561 6,262 (620) 802 ($ in millions except per share amounts) For the year ended December 31: Revenue Services Sales Financing Total revenue Cost Services Sales Financing Total cost Gross profit Expense and other (income) Selling, general and administrative Research, development and engineering Intellectual property and custom development income Other (income, and expense Interest expense Total expense and other (income) Income from continuing operations before income taxes Provision for/(benefit from) income taxes Income from continuing operations Income/(loss) from discontinued operations, net of tax Net income Earnings/(loss) per share of common stock Assuming dilution Continuing operations Discontinued operations Total Basic Continuing operations Discontinued operations Total Weighted average number of common shares outstanding Assuming dilution Basic Q&U 18,745 6,488 (612) 873 1,155 26,649 4,837 124 4,712 1,030 $ 5,743 18,724 5,910 (639) (1,012) 1,344 24,327 7,206 60 7,146 2,285 $ 9,431 1,288 28,293 2,572 (1,360) 3,932 1,658 $ 5,590 H . $ $ I I I 5.21 1.14 6.35 4.38 1.85 6.23 $ 8.00 2.56 $ 10.56 $ $ $ $ I I I 5.26 1.15 6.41 4.42 1.86 6.28 $ 8.05 2.58 $ 10.63 $ $ 904,641,001 895,990,771 896,563,971 890,348,679 892,813,376 887,235,105 Notes 2020 2019 2018 $45,004 27,484 1,133 73,620 $47,493 28,252 1,402 77,147 $49,257 28,735 1,599 79,591 30,404 6,934 708 38,046 35,575 32,491 7,263 904 40,659 36,488 33,687 7,835 1,132 42,655 36,936 F ($ in millions except per share amounts) For the year ended December 31: Revenue Services Sales Financing Total revenue Cost Services Sales Financing Total cost Gross profit Expense and other (income) Selling, general and administrative Research, development and engineering Intellectual property and custom development income Other (income) and expense Interest expense Total expense and other (income) Income from continuing operations before income taxes Provision for/(benefit from) income taxes Income from continuing operations Income/(Loss) from discontinued operations, net of tax Net income Earnings/(loss) per share of common stock Assuming dilution Continuing operations Discontinued operations Total Basic Continuing operations Discontinued operations Total Weighted-average number of common shares outstanding Assuming dilution Basic P&T 23,082 6,333 (626) 861 1,288 30,937 4,637 (864) 5,501 89 $ 5,590 20,604 5,989 (648) (968) 1,344 26,322 10,166 731 9,435 (4) $ 9,431 19,366 5,379 (1,026) 1,152 723 25,594 11,342 2,619 8,723 5 $ 8,728 G H H H $ 6.13 0.10 $ 6.23 $ 10.57 (0.01) $ 10.56 $ 9.51 0.01 $ 9.52 H H H $ 6.18 0.10 $ 6.28 $ 10.63 0.00 $ 10.63 $ 9.56 0.01 $ 9.57 896,563,971 890,348,679 892,813,376 887,235,105 916,315,714 912,048,072 Notes 2017 2016 2015 $50,709 26,715 1,715 79,139 $51,268 26,942 1,710 79,919 $49,911 29,967 1,864 81,741 T 34,447 7,256 1,210 42,913 36,227 34,021 6,559 1,044 41,625 38,294 33,126 6,920 1,011 41,057 40,684 ($ in millions except per share amounts) For the year ended December 31: Revenue Services Sales Financing Total revenue Cost Services Sales Financing Total cost Gross profit Expense and other income) Selling, general and administrative Research, development and engineering Intellectual property and custom development income Other (income) and expense Interest expense Total expense and other (income) Income from continuing operations before income taxes Provision for income taxes Income from continuing operations Loss from discontinued operations, net of tax Net income Earnings/(loss) per share of common stock Assuming dilution Continuing operations Discontinued operations Total Basic Continuing operations Discontinued operations Total Weighted-average number of common shares outstanding Assuming dilution Basic D&J 20,107 5,787 (1,466) (216) 615 24,827 11,400 5,642 5,758 (5) $ 5,753 21,069 5,751 (1,631) 145 630 25,964 12,330 449 11,881 (9) $11,872 20,430 5,247 (682) (724) 468 24,740 15,945 2,581 13,364 (174) $13,190 N P P $ 6.14 0.00 $ 6.14 $ 12.39 (0.01) $ 12.38 $ 13.60 (0.18) $ 13.42 P P $ 6.17 0.00 $ 6.17 $ 12.44 (0.01) $ 12.43 $ 13.66 (0.18) $ 13.48 U 937,385,625 932,828,295 958,714,097 955,422,530 982,700,267 978,744,523


