Question
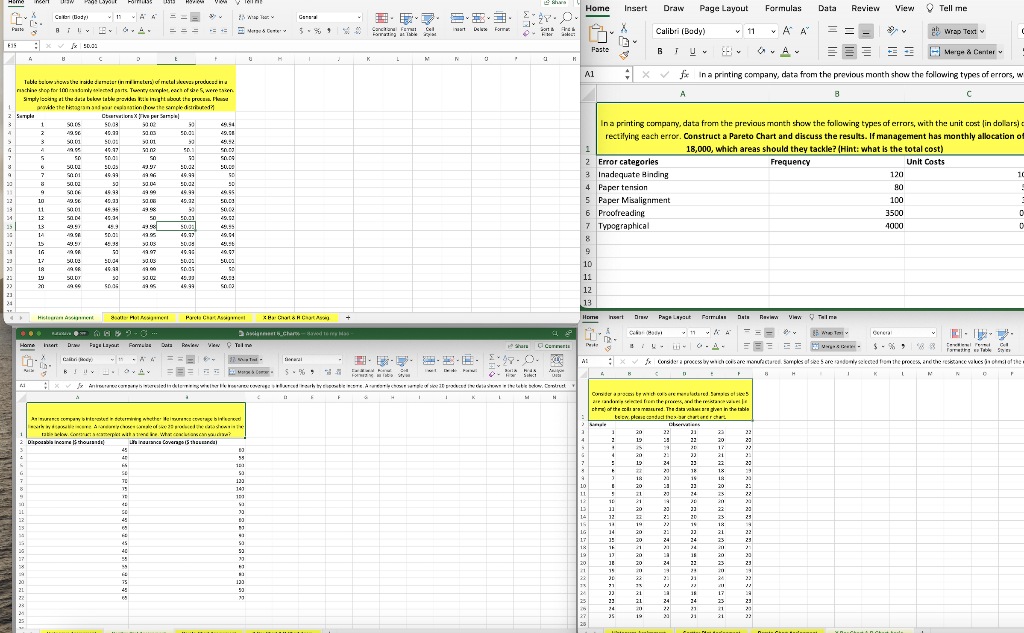
*Using Excel* Based on the instruction in each worksheet, create the following chart and provide explanation. Formulate a histogram about the inside diameter of metal
*Using Excel*
Based on the instruction in each worksheet, create the following chart and provide explanation.
Formulate a histogram about the inside diameter of metal sleeves (Hint: the histogram needs to include all 100 observations). Provide your explanation about the histogram chart.
Formulate a scatter plot with a trend line to show the relationship between disposable income and life insurance coverage. Reach your conclusion about the two variables.
Formulate a Pareto Chart regarding the data about types of error in a printing company (Hint: the pareto chart need to be created based on the total cost, only unit costs is given currently). Discuss the results found based on the pareto chart: if management has monthly allocation of $18,000, which areas should they tackle?
Based on the cols manufacturing data, conduct the x-bar chart and r chart. How to interpret the two charts?
Step by Step Solution
There are 3 Steps involved in it
Step: 1

Get Instant Access to Expert-Tailored Solutions
See step-by-step solutions with expert insights and AI powered tools for academic success
Step: 2

Step: 3

Ace Your Homework with AI
Get the answers you need in no time with our AI-driven, step-by-step assistance
Get Started


