

Answered step by step
Verified Expert Solution
Question
1 Approved Answer
Using Excel - Constructing a crosstabulation using PivotTable To answer the questions that follow, download an Excel worksheet containing the demographic data for a sample
Using Excel Constructing a crosstabulation using PivotTable To answer the questions that follow, download an Excel worksheet containing the demographic data for a sample of adults by clicking on the following words in bold: Download Excel File. Suppose you are interested in the number of people in each age category, broken down by gender. In other words, you want to create what is often referred to as a "crosstabulation table," or a "contingency table," using the variables gender and age category. Use Excel's PivotTable report to create a crosstabulation table, showing the values of gender as the row headings and the values of age category as the column headings. Use your results to complete the following table. Note: The rows and columns of the following table may not match the order in your PivotTable report. You can follow the directions for "Reordering the Columns of the PivotTable Report" one of the choices in the following table of instructions to reorder the columns of your PivotTable. To reorder rows, follow the same directions, but apply them to the row labels. Excel Instructions Display the Initial PivotTable Field List and Report Set Up the PivotTable Field List Reordering the Columns of the PivotTable Report Grouping Years of Schooling into Classes Click the Insert tab on the Ribbon. In the Tables group, click on the icon above the word PivotTable. When the Create PivotTable dialog box appears: Choose Select a Table or Range. Select all of the data A:J Choose New Worksheet as the place where the PivotTable report should be placed. Click OK Now suppose instead of wanting to know the number of people in each age category broken down by gender, you want these frequencies broken down by whether each person had or more years of schooling. To do this, you will need to switch the row variable in your PivotTable report and group this field. Do this by dragging the gender out of the Row Labels area of the PivotTable Field List and dragging the years of schooling field into the Row Labels area. Then follow the directions provided to group years of schooling into the categories "fewer than years" and years or more." Use your results to complete the following table. 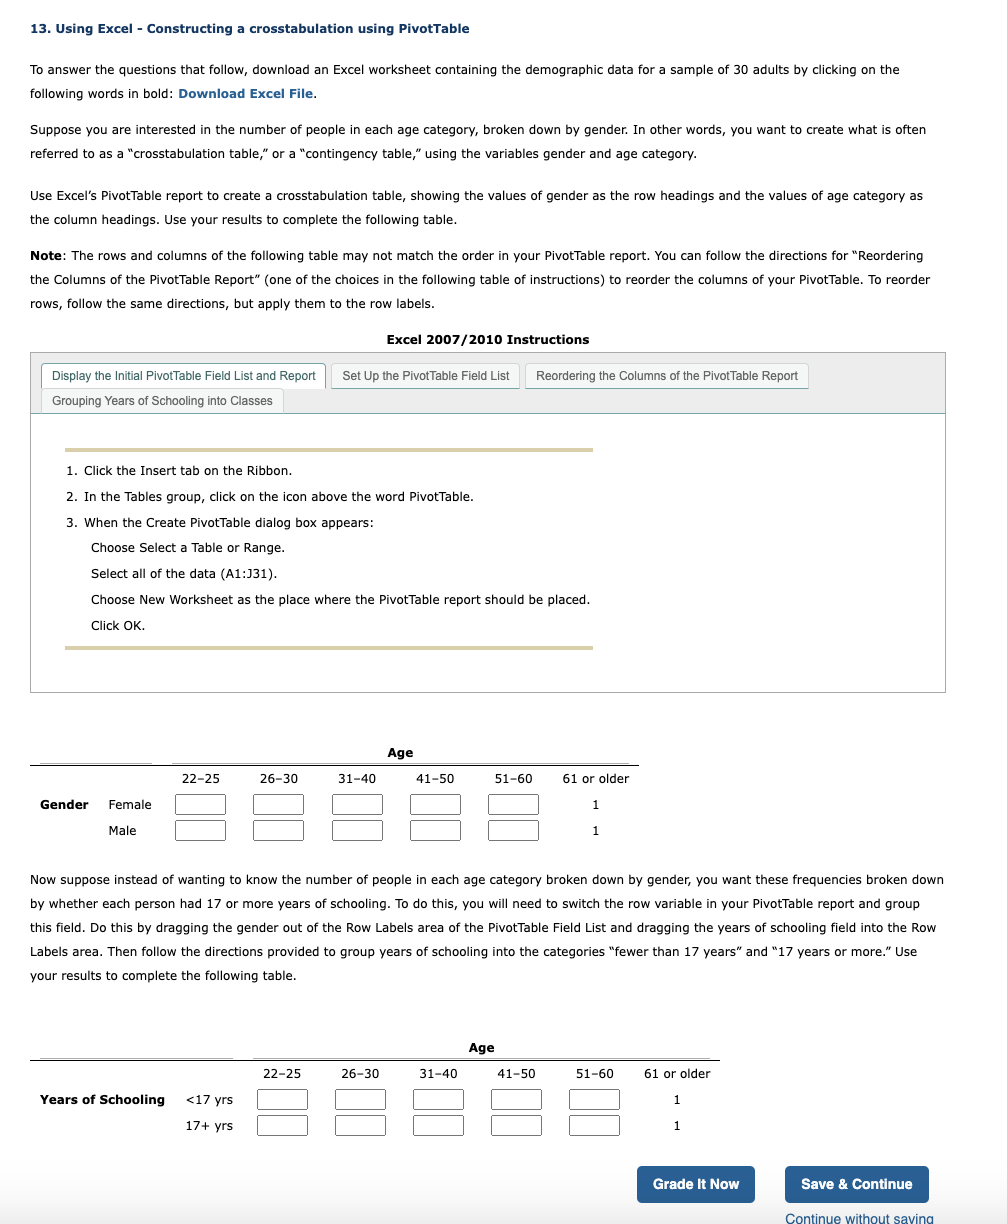
Using Excel Constructing a crosstabulation using PivotTable
To answer the questions that follow, download an Excel worksheet containing the demographic data for a sample of adults by clicking on the
following words in bold: Download Excel File.
Suppose you are interested in the number of people in each age category, broken down by gender. In other words, you want to create what is often
referred to as a "crosstabulation table," or a "contingency table," using the variables gender and age category.
Use Excel's PivotTable report to create a crosstabulation table, showing the values of gender as the row headings and the values of age category as
the column headings. Use your results to complete the following table.
Note: The rows and columns of the following table may not match the order in your PivotTable report. You can follow the directions for "Reordering
the Columns of the PivotTable Report" one of the choices in the following table of instructions to reorder the columns of your PivotTable. To reorder
rows, follow the same directions, but apply them to the row labels.
Excel Instructions
Display the Initial PivotTable Field List and Report
Set Up the PivotTable Field List
Reordering the Columns of the PivotTable Report
Grouping Years of Schooling into Classes
Click the Insert tab on the Ribbon.
In the Tables group, click on the icon above the word PivotTable.
When the Create PivotTable dialog box appears:
Choose Select a Table or Range.
Select all of the data A:J
Choose New Worksheet as the place where the PivotTable report should be placed.
Click OK
Now suppose instead of wanting to know the number of people in each age category broken down by gender, you want these frequencies broken down
by whether each person had or more years of schooling. To do this, you will need to switch the row variable in your PivotTable report and group
this field. Do this by dragging the gender out of the Row Labels area of the PivotTable Field List and dragging the years of schooling field into the Row
Labels area. Then follow the directions provided to group years of schooling into the categories "fewer than years" and years or more." Use
your results to complete the following table.
Step by Step Solution
There are 3 Steps involved in it
Step: 1

Get Instant Access to Expert-Tailored Solutions
See step-by-step solutions with expert insights and AI powered tools for academic success
Step: 2

Step: 3
Ace Your Homework with AI
Get the answers you need in no time with our AI-driven, step-by-step assistance
Get Started
Intermediate Accounting principles and analysis
Authors: Terry d. Warfield, jerry j. weygandt, Donald e. kieso
2nd Edition
471737933, 978-0471737933