Answered step by step
Verified Expert Solution
Link Copied!

Question

1 Approved Answer

* Using Excel do the following problem using the High-Low Method and Regression Analysis and turn in the Excel file including your recommendations. * Feel

* Using "Excel" do the following problem using the High-Low Method and Regression Analysis and turn in the Excel file including your recommendations. * Feel free to ask any questions concerning this project. You can discuss this project with other classmates, but do not copy somebody else's outputs. Remember the due date. *To run the regression using the Excel Program, use Tools, Data Analysis, Regression and choose x cost driver and y costs we want to predict. If you use regression for the first time, click File, Options, in left column then click Add-ins, Analysis toolpak, Regression just for setting up the regression program once. If you use Apple or Mac computer, there are instructions in Blackboard how to run regression analysis.

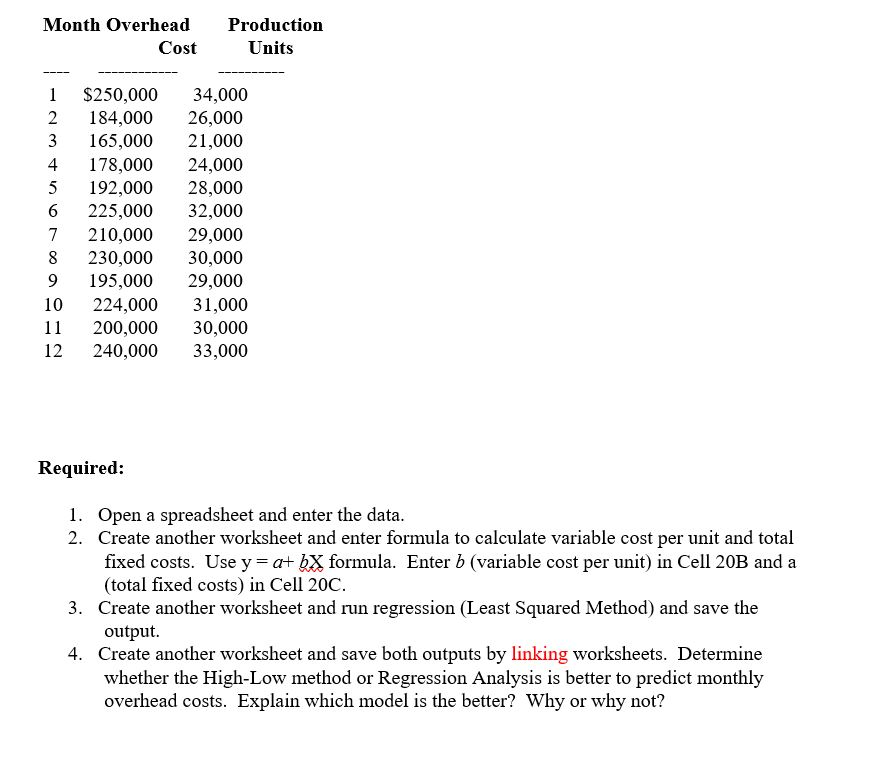
Problem: The King Corporation is developing a model to explain and predict overhead costs. It produces only one product-line so that a simple count of the number of units produced each month may be a good measure of activity to begin with. The company has collected data for the past twelve months:

image text in transcribed

image text in transcribed

Month Overhead Cost Production Units ---- 4 $250,000 184,000 165,000 178,000 192,000 225,000 210,000 230,000 195,000 224,000 200,000 240,000 34,000 26,000 21,000 24.000 28,000 32,000 29,000 30,000 29,000 31,000 30,000 33,000 9 10 11 12 Required: 1. Open a spreadsheet and enter the data. 2. Create another worksheet and enter formula to calculate variable cost per unit and total fixed costs. Use y=a+ bX formula. Enter b (variable cost per unit) in Cell 20B and a (total fixed costs) in Cell 20C. 3. Create another worksheet and run regression (Least Squared Method) and save the output. 4. Create another worksheet and save both outputs by linking worksheets. Determine whether the High-Low method or Regression Analysis is better to predict monthly overhead costs. Explain which model is the better? Why or why not? 5. Use absolute cell address in y= a +bX formula (Use absolute August X Value) to predict January and December overhead costs. Do you think these predicted overhead costs are reasonable? (Refer to our textbook from pp. 221-223 for regression analysis details.) Month Overhead Cost Production Units ---- 4 $250,000 184,000 165,000 178,000 192,000 225,000 210,000 230,000 195,000 224,000 200,000 240,000 34,000 26,000 21,000 24.000 28,000 32,000 29,000 30,000 29,000 31,000 30,000 33,000 9 10 11 12 Required: 1. Open a spreadsheet and enter the data. 2. Create another worksheet and enter formula to calculate variable cost per unit and total fixed costs. Use y=a+ bX formula. Enter b (variable cost per unit) in Cell 20B and a (total fixed costs) in Cell 20C. 3. Create another worksheet and run regression (Least Squared Method) and save the output. 4. Create another worksheet and save both outputs by linking worksheets. Determine whether the High-Low method or Regression Analysis is better to predict monthly overhead costs. Explain which model is the better? Why or why not? 5. Use absolute cell address in y= a +bX formula (Use absolute August X Value) to predict January and December overhead costs. Do you think these predicted overhead costs are reasonable? (Refer to our textbook from pp. 221-223 for regression analysis details.)

Step by Step Solution

There are 3 Steps involved in it

Step: 1

blur-text-image

Get Instant Access to Expert-Tailored Solutions

See step-by-step solutions with expert insights and AI powered tools for academic success

Step: 2

blur-text-image

Step: 3

blur-text-image

Ace Your Homework with AI

Get the answers you need in no time with our AI-driven, step-by-step assistance

Get Started

Recommended Textbook for

Advanced Financial Accounting An IFRS Standards Approach

Authors: Pearl Tan, Chu Yeong Lim, Ee Wen Kuah

4th Edition

9789814821278, 9814821276

More Books