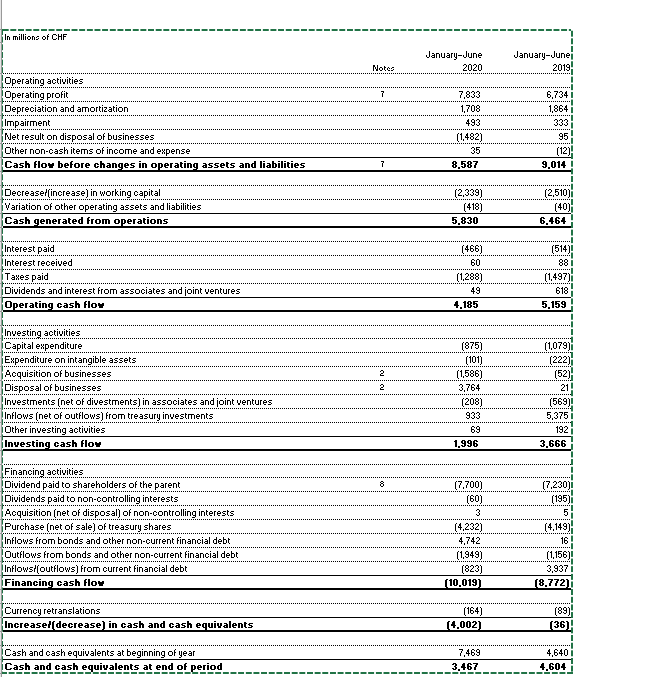
Using Excel Software and a recent Statement of Cash Flow for any publicly traded company prepare the following: 1. Statement of Sources and Uses of Cash? 2. Draw a chart of Cash Sources? 3. Comment on the highest sources of cash and the lowest sources of Cash? 4. Draw a chart of Cash Uses? 5. Comment of the highest uses of cash and the lowest uses of Cash? In millions of CHF January-June 2020 January-June 2019 Notes 7 Operating activities Operating profit Depreciation and amortization Impairment Net result on disposal of businesses Other non-cash items of income and expense Cash flow before changes in operating assets and liabilities 7.833 1,708 493 (1.482) 35 8.587 6.734 i 1,864 i 333 95 (12) 9.014 7 Decrease increase) in working capital Variation of other operating assets and liabilities Cash generated from operations (2,339) (418) (2,510) (40) 6.464 5.830 Interest paid Interest received Taxes paid Dividends and interest from associates and joint ventures Operating cash flow (466) 60 (1,288) 49 4,185 (514)! 88 (1,497) 618 5,159 2 Investing aotivities Capital expenditure Expenditure on intangible assets Acquisition of businesses Disposal of businesses Investments (net of divestments) in associates and joint ventures Inflows (net of outflows) from treasury investments Other investing activities Investing cash flow 2 (875) (101) (1,586) 3,764 (208) 933 69 1.996 (1,079) (222) (52) 21 (569) 5,375 i 192 3,666 .... (7.230) (195) Financing activities. Dividend paid to shareholders of the parent Dividends paid to non-controlling interests Acquisition (net of disposal) of non-controlling interests Purchase (net of sale) of treasury shares Inflows from bonds and other non-current financial debt Outflows from bonds and other non-current financial debt Inflows.(outflows) from current financial debt Financing cash floy (7.700) (60) 3 (4,232) 4,742 (1.949) (823) (10.019) (4.149) 16 (1,156)! 3,9371 (8.772) Currency retranslations Increasel decrease in cash and cash equivalents (164) (4.002) (89) (36) Cash and cash equivalents at beginning of year Cash and cash equivalents at end of period 7,469 3.467 4,640 4,604 Using Excel Software and a recent Statement of Cash Flow for any publicly traded company prepare the following: 1. Statement of Sources and Uses of Cash? 2. Draw a chart of Cash Sources? 3. Comment on the highest sources of cash and the lowest sources of Cash? 4. Draw a chart of Cash Uses? 5. Comment of the highest uses of cash and the lowest uses of Cash? In millions of CHF January-June 2020 January-June 2019 Notes 7 Operating activities Operating profit Depreciation and amortization Impairment Net result on disposal of businesses Other non-cash items of income and expense Cash flow before changes in operating assets and liabilities 7.833 1,708 493 (1.482) 35 8.587 6.734 i 1,864 i 333 95 (12) 9.014 7 Decrease increase) in working capital Variation of other operating assets and liabilities Cash generated from operations (2,339) (418) (2,510) (40) 6.464 5.830 Interest paid Interest received Taxes paid Dividends and interest from associates and joint ventures Operating cash flow (466) 60 (1,288) 49 4,185 (514)! 88 (1,497) 618 5,159 2 Investing aotivities Capital expenditure Expenditure on intangible assets Acquisition of businesses Disposal of businesses Investments (net of divestments) in associates and joint ventures Inflows (net of outflows) from treasury investments Other investing activities Investing cash flow 2 (875) (101) (1,586) 3,764 (208) 933 69 1.996 (1,079) (222) (52) 21 (569) 5,375 i 192 3,666 .... (7.230) (195) Financing activities. Dividend paid to shareholders of the parent Dividends paid to non-controlling interests Acquisition (net of disposal) of non-controlling interests Purchase (net of sale) of treasury shares Inflows from bonds and other non-current financial debt Outflows from bonds and other non-current financial debt Inflows.(outflows) from current financial debt Financing cash floy (7.700) (60) 3 (4,232) 4,742 (1.949) (823) (10.019) (4.149) 16 (1,156)! 3,9371 (8.772) Currency retranslations Increasel decrease in cash and cash equivalents (164) (4.002) (89) (36) Cash and cash equivalents at beginning of year Cash and cash equivalents at end of period 7,469 3.467 4,640 4,604