using excel with formulas please

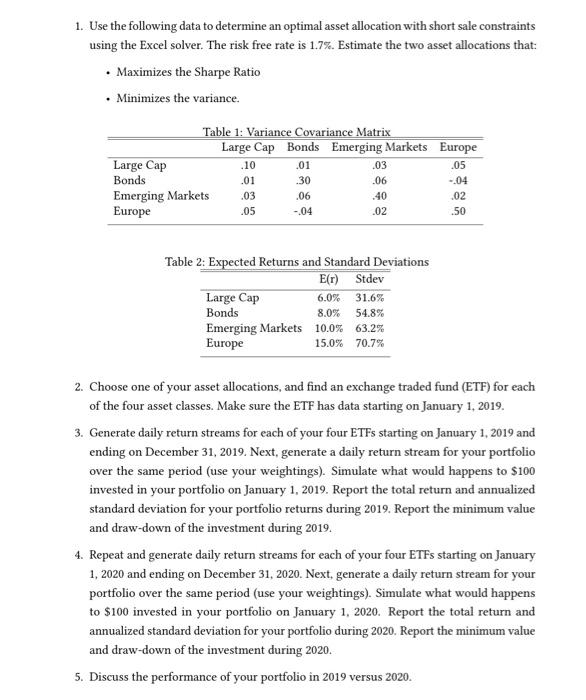
1. Use the following data to determine an optimal asset allocation with short sale constraints using the Excel solver. The risk free rate is 1.7%. Estimate the two asset allocations that: Maximizes the Sharpe Ratio Minimizes the variance. .05 Table 1: Variance Covariance Matrix Large Cap Bonds Emerging Markets Europe Large Cap .10 .01 .03 Bonds .01 .06 -.04 Emerging Markets .02 Europe .02 30 .03 .06 .40 .05 -.04 .50 Table 2: Expected Returns and Standard Deviations E(r) Stdev Large Cap 6.0% 31.6% Bonds 54.8% Emerging Markets 10.0% 63.2% Europe 15.0% 70.7% 8.0% 2. Choose one of your asset allocations, and find an exchange traded fund (ETF) for each of the four asset classes. Make sure the ETF has data starting on January 1, 2019. 3. Generate daily return streams for each of your four ETFs starting on January 1, 2019 and ending on December 31, 2019. Next, generate a daily return stream for your portfolio over the same period (use your weightings). Simulate what would happens to $100 invested in your portfolio on January 1, 2019. Report the total return and annualized standard deviation for your portfolio returns during 2019. Report the minimum value and draw-down of the investment during 2019. 4. Repeat and generate daily return streams for each of your four ETFs starting on January 1, 2020 and ending on December 31, 2020. Next, generate a daily return stream for your portfolio over the same period (use your weightings). Simulate what would happens to $100 invested in your portfolio on January 1, 2020. Report the total return and annualized standard deviation for your portfolio during 2020. Report the minimum value and draw-down of the investment during 2020. 5. Discuss the performance of your portfolio in 2019 versus 2020. 1. Use the following data to determine an optimal asset allocation with short sale constraints using the Excel solver. The risk free rate is 1.7%. Estimate the two asset allocations that: Maximizes the Sharpe Ratio Minimizes the variance. .05 Table 1: Variance Covariance Matrix Large Cap Bonds Emerging Markets Europe Large Cap .10 .01 .03 Bonds .01 .06 -.04 Emerging Markets .02 Europe .02 30 .03 .06 .40 .05 -.04 .50 Table 2: Expected Returns and Standard Deviations E(r) Stdev Large Cap 6.0% 31.6% Bonds 54.8% Emerging Markets 10.0% 63.2% Europe 15.0% 70.7% 8.0% 2. Choose one of your asset allocations, and find an exchange traded fund (ETF) for each of the four asset classes. Make sure the ETF has data starting on January 1, 2019. 3. Generate daily return streams for each of your four ETFs starting on January 1, 2019 and ending on December 31, 2019. Next, generate a daily return stream for your portfolio over the same period (use your weightings). Simulate what would happens to $100 invested in your portfolio on January 1, 2019. Report the total return and annualized standard deviation for your portfolio returns during 2019. Report the minimum value and draw-down of the investment during 2019. 4. Repeat and generate daily return streams for each of your four ETFs starting on January 1, 2020 and ending on December 31, 2020. Next, generate a daily return stream for your portfolio over the same period (use your weightings). Simulate what would happens to $100 invested in your portfolio on January 1, 2020. Report the total return and annualized standard deviation for your portfolio during 2020. Report the minimum value and draw-down of the investment during 2020. 5. Discuss the performance of your portfolio in 2019 versus 2020


