Answered step by step
Verified Expert Solution
Question
1 Approved Answer
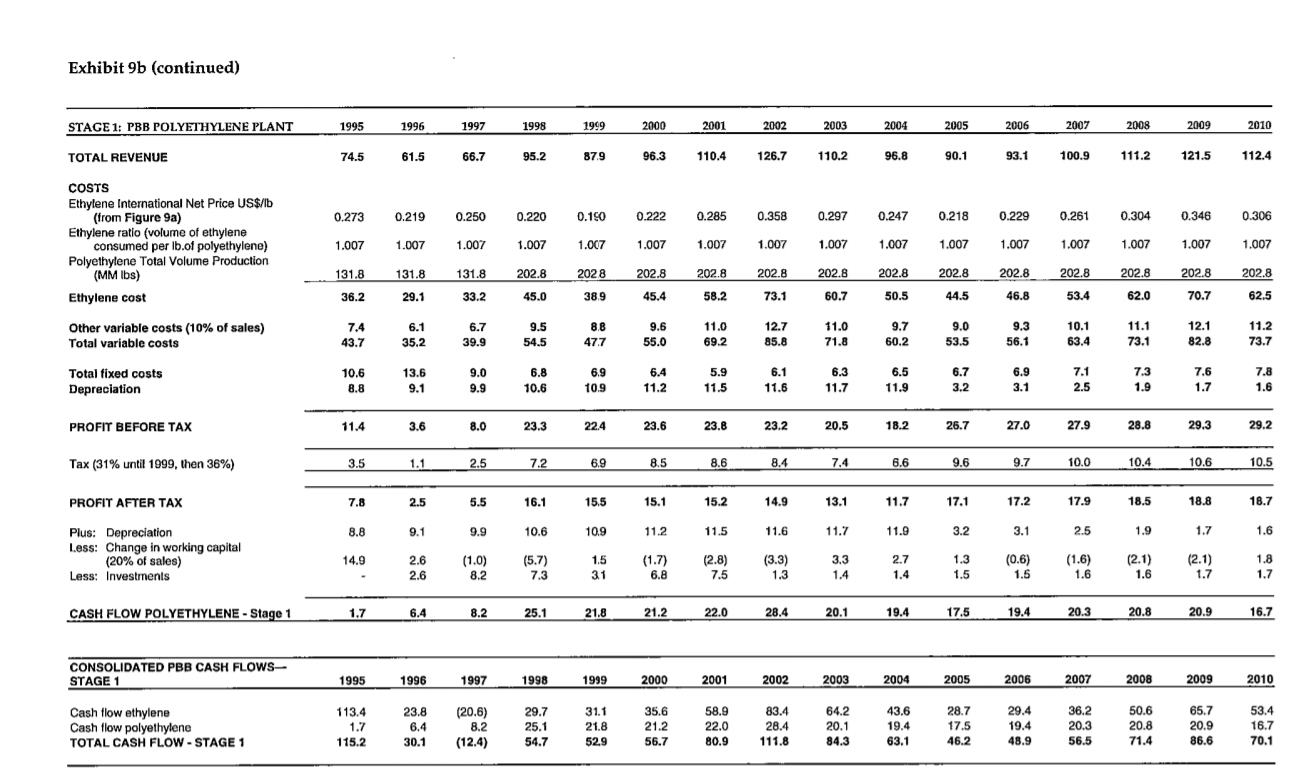
Using Exhibit 9a & 9b (Consolidated PBB) & information in the case on valuation find the following: 1. Stage/Phase 1 - PBB PV (@ R

Using Exhibit 9a & 9b (Consolidated PBB) & information in the case on valuation find the following:
1. Stage/Phase 1 - PBB PV (@ R = ______% from Jan-96) _________
Exhibit 9b (continued) STAGE 1: PBB POLYETHYLENE PLANT TOTAL REVENUE 1995 74.5 1996 61.5 1997 66.7 1998 95.2 1999 87.9 2000_ 96.3 2001 110.4 2002 126.7 2003 110.2 2004 96.8 2005 90. 1 2006_ 9 3.1 2007 100. 9 2008 111.2 2009 121.5 2010 112.4 0.273 0.219 0.250 0.220 0.150 0.222 0.285 0.358 0.297 0.247 0.218 0.229 0.261 0.304 0.346 0.306 COSTS Ethylene International Net Price US$/b (from Figure 9a) Ethylene ratio (volume of ethylene consumed per Ib.of polyethylene) Polyethylene Total Volume Production (MM lbs) Ethylene cost 1.007 1.007 1.007 1.007 1.007 1.007 1.007 1.007 1.007 1.007 1.007 1.007 1.007 1.007 1.007 1.007 202.8 202.8 131.8 36.2 131.8 29.1 131.8 33.2 2028 38.9 202.8 45.4 202.8 58.2 202.8 60.7 202.8 50.5 202.8 44.5 202.8 46.8 202.8 53.4 202.8 62.0 202.8 70.7 45.0 73.1 202.8 62.5 11.2 7.4 8.8 12.1 Other variable costs (10% of sales) Total variable costs 6.1 35.2 6.7 39.9 9.5 54.5 9.6 55.0 11.0 69.2 12.7 85.8 11.0 71.8 9.7 60.2 9.0 53.5 9.3 56.1 10.1 63.4 11.1 73.1 43.7 477 9.0 6.8 6.9 6.1 6.3 6.7 Total fixed costs Depreciation 10.6 8.8 13.6 9.1 6.4 11.2 5.9 11.5 6.5 11.9 6.9 3.1 7.8 1.6 9.9 10.6 10.9 11.6 11.7 3.2 2.5 1.9 1.7 PROFIT BEFORE TAX 23.6 29.2 Tax (31% until 1999, then 36%) 11.4 3.5 7.8 8.8 3.6 1.1_ 2.5 9.1 8.0 2.5 5.5 9.9 (1.0) 23.3 7.2 16.1 10.6 224 6.9 15.5 10.9 20.5 7.4 13.1 11.7 18.2 6.6 11.7 11.8 8.6__8.4 15.2 14.9 11.5 11.6 (2.8) 26.7 9.6 17.1 3.2 27.0 9.7 17.2 3.1 27.9 10.0 17.9 2.5 28.8 29.3 10.4 ___10.6 18.5 18.8 1.9 1.7 PROFIT AFTER TAX 15.1 11.2 10.5 18.7 1.6 Plus: Depreciation Less: Change in working capital (20% of sales) Less: Investments (5.7) (1.7) (3.3) (0.6) (2.1) 1.5 31 7.3 (1.6) 1.6 (2.1) 1.6 8.2 7.5 1.3 CASH FLOW POLYETHYLENE - Stage 1 1.7 6.4 8.2 25.1 21.8 21.2 22.0 28.4 20.1 19.4 17.5 19.4 20.3_ 20.8 20.9 16.7 CONSOLIDATED PBB CASH FLOWS- STAGE 1 1995 1996 1997 1998 1999 2000 2001 2002 2003 2004 2005 2006 2007 2008 2009 2010 113.4 23.8 (20.6) 29.4 36.2 Cash flow ethylene Cash flow polyethylene TOTAL CASH FLOW - STAGE 1 1.7 6.4 8.2 29.7 25.1 54.7 31.1 21.8 52.9 35.6 21.2 56.7 58.9 22.0 80.9 83.4 28.4 111.8 64.2 20.1 84.3 43.6 19.4 63.1 28.7 17.5 46.2 19.4 20.3 50.6 20.8 71.4 65.7 20.9 86.6 53.4 16.7 70.1 115.2 30.1 (12.4) 48.9 56.5 Exhibit 9b (continued) STAGE 1: PBB POLYETHYLENE PLANT TOTAL REVENUE 1995 74.5 1996 61.5 1997 66.7 1998 95.2 1999 87.9 2000_ 96.3 2001 110.4 2002 126.7 2003 110.2 2004 96.8 2005 90. 1 2006_ 9 3.1 2007 100. 9 2008 111.2 2009 121.5 2010 112.4 0.273 0.219 0.250 0.220 0.150 0.222 0.285 0.358 0.297 0.247 0.218 0.229 0.261 0.304 0.346 0.306 COSTS Ethylene International Net Price US$/b (from Figure 9a) Ethylene ratio (volume of ethylene consumed per Ib.of polyethylene) Polyethylene Total Volume Production (MM lbs) Ethylene cost 1.007 1.007 1.007 1.007 1.007 1.007 1.007 1.007 1.007 1.007 1.007 1.007 1.007 1.007 1.007 1.007 202.8 202.8 131.8 36.2 131.8 29.1 131.8 33.2 2028 38.9 202.8 45.4 202.8 58.2 202.8 60.7 202.8 50.5 202.8 44.5 202.8 46.8 202.8 53.4 202.8 62.0 202.8 70.7 45.0 73.1 202.8 62.5 11.2 7.4 8.8 12.1 Other variable costs (10% of sales) Total variable costs 6.1 35.2 6.7 39.9 9.5 54.5 9.6 55.0 11.0 69.2 12.7 85.8 11.0 71.8 9.7 60.2 9.0 53.5 9.3 56.1 10.1 63.4 11.1 73.1 43.7 477 9.0 6.8 6.9 6.1 6.3 6.7 Total fixed costs Depreciation 10.6 8.8 13.6 9.1 6.4 11.2 5.9 11.5 6.5 11.9 6.9 3.1 7.8 1.6 9.9 10.6 10.9 11.6 11.7 3.2 2.5 1.9 1.7 PROFIT BEFORE TAX 23.6 29.2 Tax (31% until 1999, then 36%) 11.4 3.5 7.8 8.8 3.6 1.1_ 2.5 9.1 8.0 2.5 5.5 9.9 (1.0) 23.3 7.2 16.1 10.6 224 6.9 15.5 10.9 20.5 7.4 13.1 11.7 18.2 6.6 11.7 11.8 8.6__8.4 15.2 14.9 11.5 11.6 (2.8) 26.7 9.6 17.1 3.2 27.0 9.7 17.2 3.1 27.9 10.0 17.9 2.5 28.8 29.3 10.4 ___10.6 18.5 18.8 1.9 1.7 PROFIT AFTER TAX 15.1 11.2 10.5 18.7 1.6 Plus: Depreciation Less: Change in working capital (20% of sales) Less: Investments (5.7) (1.7) (3.3) (0.6) (2.1) 1.5 31 7.3 (1.6) 1.6 (2.1) 1.6 8.2 7.5 1.3 CASH FLOW POLYETHYLENE - Stage 1 1.7 6.4 8.2 25.1 21.8 21.2 22.0 28.4 20.1 19.4 17.5 19.4 20.3_ 20.8 20.9 16.7 CONSOLIDATED PBB CASH FLOWS- STAGE 1 1995 1996 1997 1998 1999 2000 2001 2002 2003 2004 2005 2006 2007 2008 2009 2010 113.4 23.8 (20.6) 29.4 36.2 Cash flow ethylene Cash flow polyethylene TOTAL CASH FLOW - STAGE 1 1.7 6.4 8.2 29.7 25.1 54.7 31.1 21.8 52.9 35.6 21.2 56.7 58.9 22.0 80.9 83.4 28.4 111.8 64.2 20.1 84.3 43.6 19.4 63.1 28.7 17.5 46.2 19.4 20.3 50.6 20.8 71.4 65.7 20.9 86.6 53.4 16.7 70.1 115.2 30.1 (12.4) 48.9 56.5Step by Step Solution
There are 3 Steps involved in it
Step: 1

Get Instant Access to Expert-Tailored Solutions
See step-by-step solutions with expert insights and AI powered tools for academic success
Step: 2

Step: 3

Ace Your Homework with AI
Get the answers you need in no time with our AI-driven, step-by-step assistance
Get Started


