

Answered step by step
Verified Expert Solution
Question
1 Approved Answer
Using Exhibits 1-3, Can you please provide financial ratios for the company, as well as describe the financial health of the company EXHIBIT 1 Financial
Using Exhibits 1-3, Can you please provide financial ratios for the company, as well as describe the financial health of the company
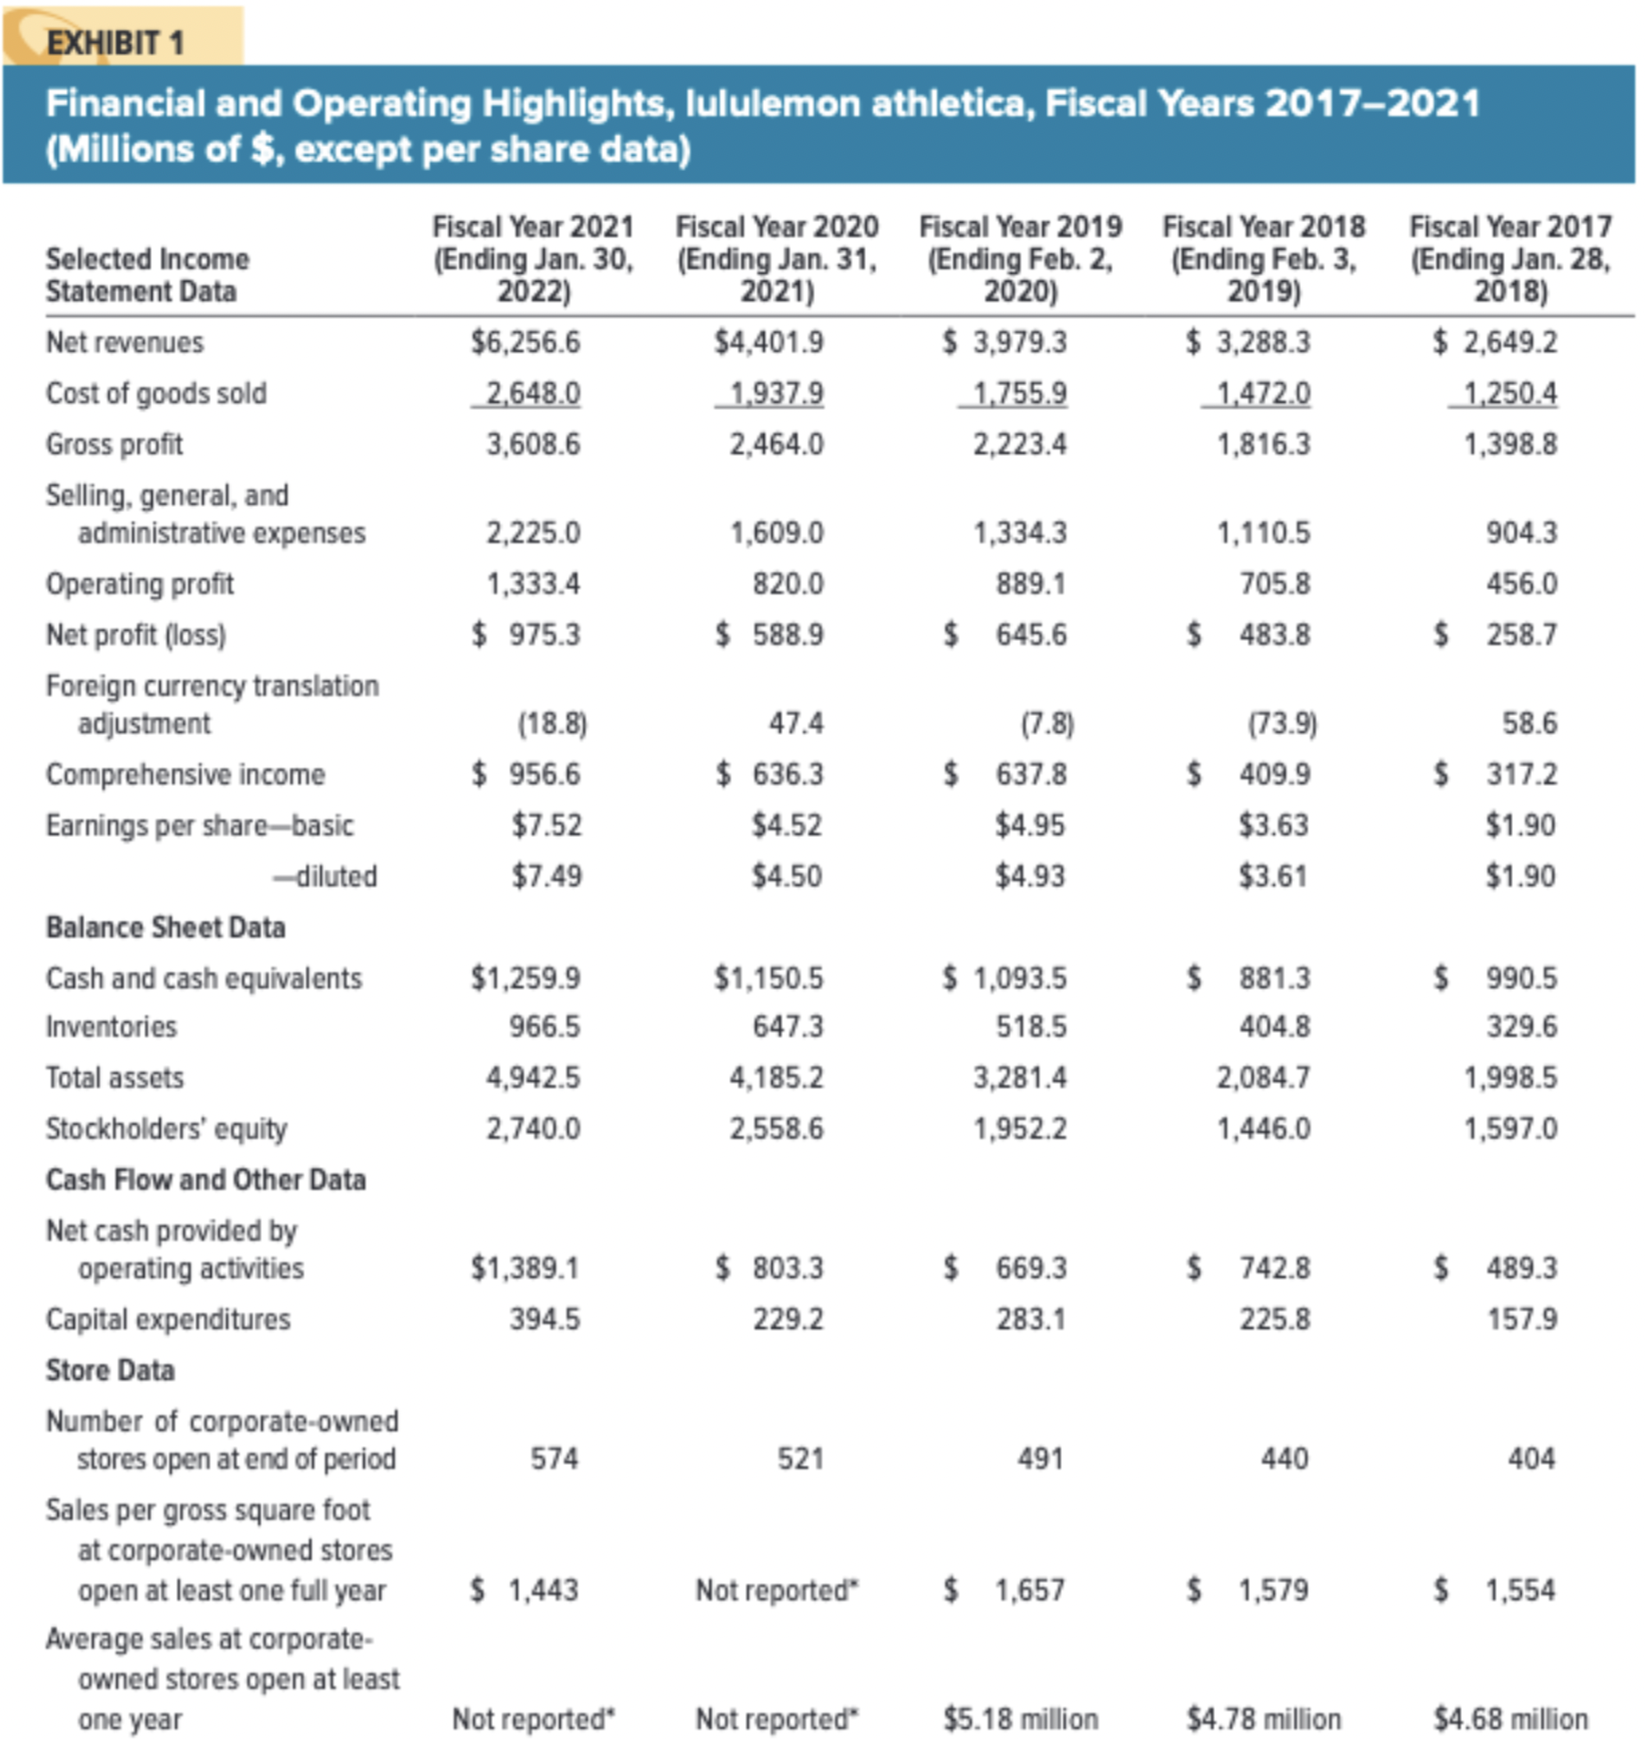
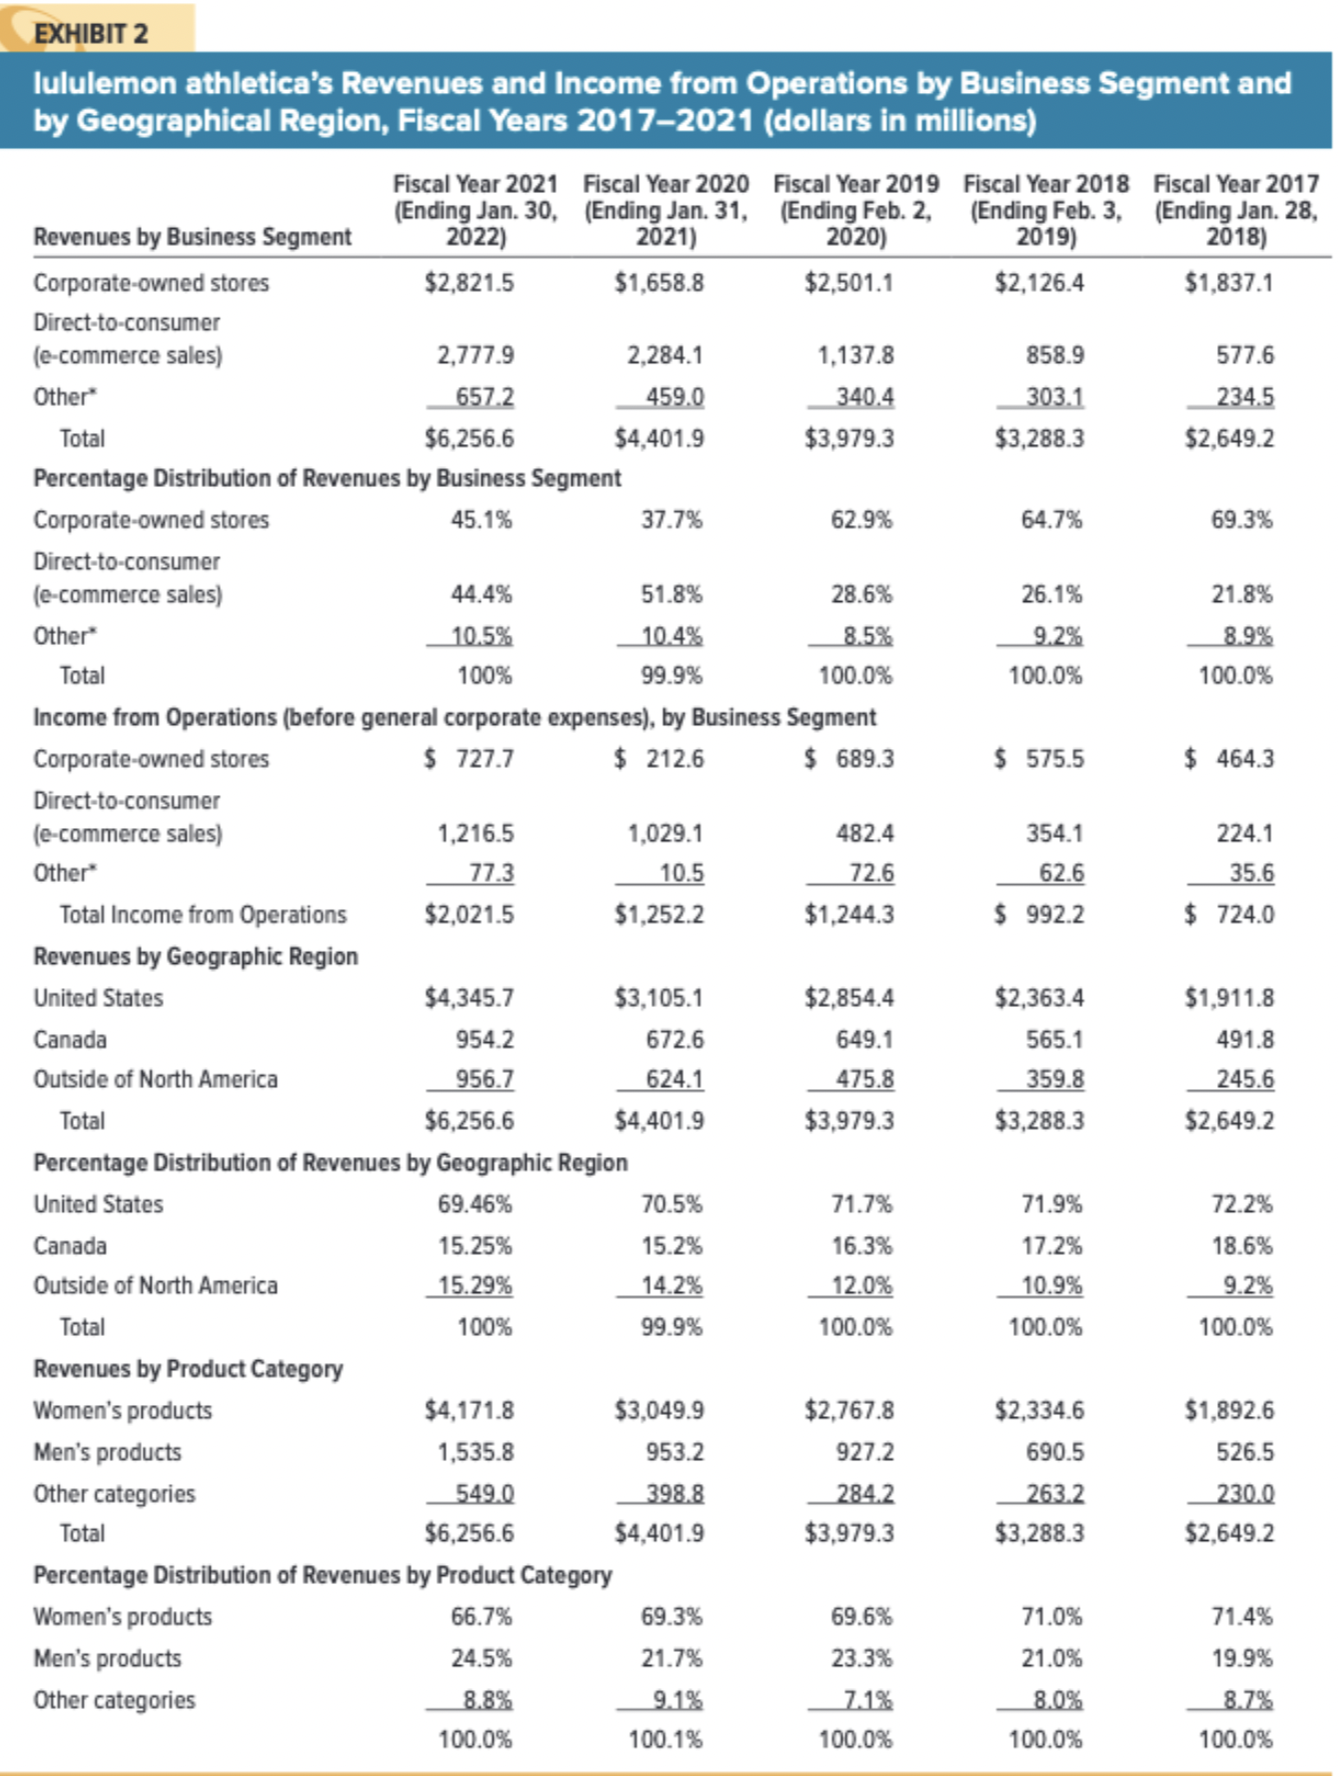
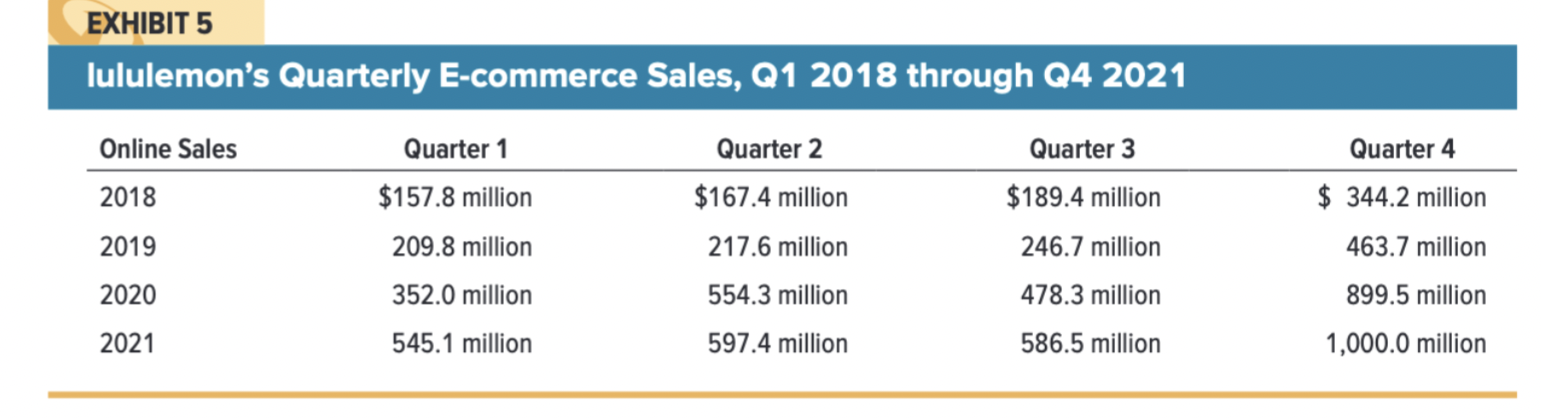
EXHIBIT 1 Financial and Operating Highlights, Iululemon athletica, Fiscal Years 2017-2021 (Millions of \$, except per share data) \begin{tabular}{|c|c|c|c|c|c|} \hline \begin{tabular}{l} Selected Income \\ Statement Data \end{tabular} & \begin{tabular}{c} Fiscal Year 2021 \\ (Ending Jan. 30, \\ 2022) \end{tabular} & \begin{tabular}{c} Fiscal Year 2020 \\ (Ending Jan. 31, \\ 2021) \end{tabular} & \begin{tabular}{c} Fiscal Year 2019 \\ (Ending Feb. 2, \\ 2020) \end{tabular} & \begin{tabular}{c} Fiscal Year 2018 \\ (Ending Feb. 3, \\ 2019) \end{tabular} & \begin{tabular}{c} Fiscal Year 2017 \\ (Ending Jan. 28, \\ 2018) \end{tabular} \\ \hline Net revenues & $6,256.6 & $4,401.9 & $3,979.3 & $3,288.3 & $2,649.2 \\ \hline Cost of goods sold & 2,648.0 & 1,937.9 & 1,755.9 & 1,472.0 & 1,250.4 \\ \hline Gross profit & 3,608.6 & 2,464.0 & 2,223.4 & 1,816.3 & 1,398.8 \\ \hline \begin{tabular}{l} Selling, general, and \\ administrative expenses \end{tabular} & 2,225.0 & 1,609.0 & 1,334.3 & 1,110.5 & 904.3 \\ \hline Operating profit & 1,333.4 & 820.0 & 889.1 & 705.8 & 456.0 \\ \hline Net profit (loss) & $975.3 & $588.9 & $645.6 & $483.8 & $258.7 \\ \hline \begin{tabular}{l} Foreign currency translation \\ adjustment \end{tabular} & (18.8) & 47.4 & (7.8) & (73.9) & 58.6 \\ \hline Comprehensive income & $956.6 & $636.3 & $637.8 & $409.9 & $317.2 \\ \hline Earnings per share-basic & $7.52 & $4.52 & $4.95 & $3.63 & $1.90 \\ \hline -diluted & $7.49 & $4.50 & $4.93 & $3.61 & $1.90 \\ \hline \multicolumn{6}{|l|}{ Balance Sheet Data } \\ \hline Cash and cash equivalents & $1,259.9 & $1,150.5 & $1,093.5 & $881.3 & $990.5 \\ \hline Inventories & 966.5 & 647.3 & 518.5 & 404.8 & 329.6 \\ \hline Total assets & 4,942.5 & 4,185.2 & 3,281.4 & 2,084.7 & 1,998.5 \\ \hline Stockholders' equity & 2,740.0 & 2,558.6 & 1,952.2 & 1,446.0 & 1,597.0 \\ \hline \multicolumn{6}{|l|}{ Cash Flow and Other Data } \\ \hline \begin{tabular}{l} Net cash provided by \\ operating activities \end{tabular} & $1,389.1 & $803.3 & $669.3 & $742.8 & $489.3 \\ \hline Capital expenditures & 394.5 & 229.2 & 283.1 & 225.8 & 157.9 \\ \hline \multicolumn{6}{|l|}{ Store Data } \\ \hline \begin{tabular}{l} Number of corporate-owned \\ stores open at end of period \end{tabular} & 574 & 521 & 491 & 440 & 404 \\ \hline \begin{tabular}{l} Sales per gross square foot \\ at corporate-owned stores \\ open at least one full year \end{tabular} & \$ 1,443 & Not reported & $1,657 & $1,579 & \$ 1,554 \\ \hline \begin{tabular}{l} Average sales at corporate- \\ owned stores open at least \\ one year \end{tabular} & Not reported* & Not reported & $5.18 million & $4.78 million & $4.68 million \\ \hline \end{tabular} EXHIBIT 5 Iululemon's Quarterly E-commerce Sales, Q1 2018 through Q4 2021 \begin{tabular}{lrrrr} Online Sales & \multicolumn{1}{c}{ Quarter 1 } & \multicolumn{1}{c}{ Quarter 2 } & \multicolumn{1}{c}{ Quarter 3 } & \multicolumn{1}{c}{ Quarter 4 } \\ \hline 2018 & \$157.8 million & \$167.4 million & $189.4 million & $344.2 million \\ 2019 & 209.8 million & 217.6 million & 246.7 million & 463.7 million \\ 2020 & 352.0 million & 554.3 million & 478.3 million & 899.5 million \\ 2021 & 545.1 million & 597.4 million & 586.5 million & 1,000.0 million \end{tabular} EXHIBIT 2 Iululemon athletica's Revenues and Income from Operations by Business Segment and by Geographical Region, Fiscal Years 2017-2021 (dollars in millions) \begin{tabular}{|c|c|c|c|c|c|} \hline Revenues by Business Segment & \begin{tabular}{c} Fiscal Year 2021 \\ (Ending Jan. 30, \\ 2022) \end{tabular} & \begin{tabular}{c} Fiscal Year 2020 \\ (Ending Jan. 31, \\ 2021 ) \end{tabular} & \begin{tabular}{c} Fiscal Year 2019 \\ (Ending Feb. 2, \\ 2020) \end{tabular} & \begin{tabular}{c} Fiscal Year 2018 \\ (Ending Feb. 3, \\ 2019 ) \end{tabular} & \begin{tabular}{c} Fiscal Year 2017 \\ (Ending Jan. 28, \\ 2018) \end{tabular} \\ \hline Corporate-owned stores & $2,821.5 & $1,658.8 & $2,501.1 & $2,126.4 & $1,837.1 \\ \hline \begin{tabular}{l} Direct-to-consumer \\ (e-commerce sales) \end{tabular} & 2,777.9 & 2,284.1 & 1,137.8 & 858.9 & 577.6 \\ \hline Other & 657.2 & 459.0 & 340.4 & 303.1 & 234.5 \\ \hline Total & $6,256.6 & $4,401.9 & $3,979.3 & $3,288.3 & $2,649.2 \\ \hline \multicolumn{6}{|c|}{ Percentage Distribution of Revenues by Business Segment } \\ \hline Corporate-owned stores & 45.1% & 37.7% & 62.9% & 64.7% & 69.3% \\ \hline \begin{tabular}{l} Direct-to-consumer \\ (e-commerce sales) \end{tabular} & 44.4% & 51.8% & 28.6% & 26.1% & 21.8% \\ \hline Other & 10.5% & 10.4% & 8.5% & 9.2% & 8.9% \\ \hline Total & 100% & 99.9% & 100.0% & 100.0% & 100.0% \\ \hline \multicolumn{6}{|c|}{ Income from Operations (before general corporate expenses), by Business Segment } \\ \hline Corporate-owned stores & $727.7 & $212.6 & $689.3 & $575.5 & $464.3 \\ \hline \begin{tabular}{l} Direct-to-consumer \\ (e-commerce sales) \end{tabular} & 1,216.5 & 1,029.1 & 482.4 & 354.1 & 224.1 \\ \hline Other & 77.3 & 10.5 & 72.6 & 62.6 & 35.6 \\ \hline Total Income from Operations & $2,021.5 & $1,252.2 & $1,244.3 & $992.2 & $724.0 \\ \hline \multicolumn{6}{|l|}{ Revenues by Geographic Region } \\ \hline United States & $4,345.7 & $3,105.1 & $2,854.4 & $2,363.4 & $1,911.8 \\ \hline Canada & 954.2 & 672.6 & 649.1 & 565.1 & 491.8 \\ \hline Outside of North America & 956.7 & 624.1 & 475.8 & 359.8 & 245.6 \\ \hline Total & $6,256.6 & $4,401.9 & $3,979.3 & $3,288.3 & $2,649.2 \\ \hline \multicolumn{6}{|c|}{ Percentage Distribution of Revenues by Geographic Region } \\ \hline United States & 69.46% & 70.5% & 71.7% & 71.9% & 72.2% \\ \hline Canada & 15.25% & 15.2% & 16.3% & 17.2% & 18.6% \\ \hline Outside of North America & 15.29% & 14.2% & 12.0% & 10.9% & 9.2% \\ \hline Total & 100% & 99.9% & 100.0% & 100.0% & 100.0% \\ \hline \multicolumn{6}{|l|}{ Revenues by Product Category } \\ \hline Women's products & $4,171.8 & $3,049.9 & $2,767.8 & $2,334.6 & $1,892.6 \\ \hline Men's products & 1,535.8 & 953.2 & 927.2 & 690.5 & 526.5 \\ \hline Other categories & 549.0 & 398.8 & 284.2 & 263.2 & 230.0 \\ \hline Total & $6,256.6 & $4,401.9 & $3,979.3 & $3,288.3 & $2,649.2 \\ \hline \multicolumn{6}{|c|}{ Percentage Distribution of Revenues by Product Category } \\ \hline Women's products & 66.7% & 69.3% & 69.6% & 71.0% & 71.4% \\ \hline Men's products & 24.5% & 21.7% & 23.3% & 21.0% & 19.9% \\ \hline \multirow[t]{2}{*}{ Other categories } & 8.8% & 9.1% & 7.1% & 8.0% & 8.7% \\ \hline & 100.0% & 100.1% & 100.0% & 100.0% & 100.0% \\ \hline \end{tabular}Step by Step Solution
There are 3 Steps involved in it
Step: 1

Get Instant Access to Expert-Tailored Solutions
See step-by-step solutions with expert insights and AI powered tools for academic success
Step: 2

Step: 3
Ace Your Homework with AI
Get the answers you need in no time with our AI-driven, step-by-step assistance
Get Started
Fundamentals of Futures and Options Markets
Authors: John C. Hull
8th edition
978-1292155036, 1292155035, 132993341, 978-0132993340