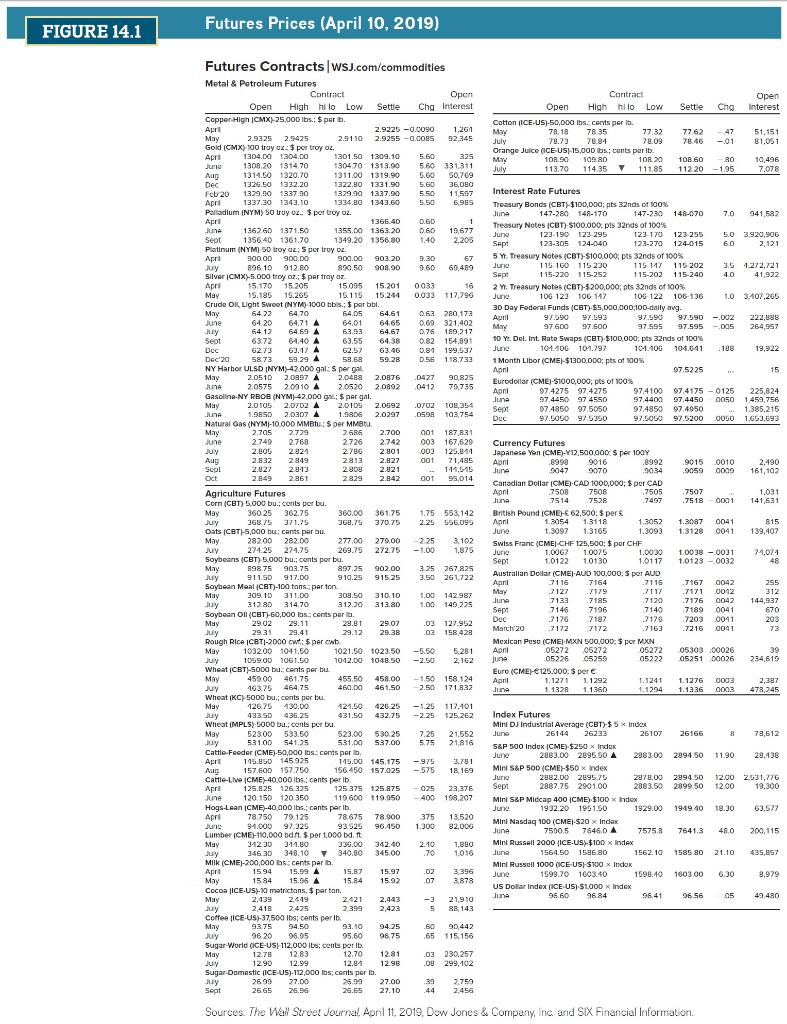
Using Figure 14.1, answer the following questions: a. What was the settle price for April 2019 hogs lean futures on this date? What is the total dollar value of this contract at the close of trading for the day? (Input all amounts as positive values. Enter the settle price in dollars rounded to 4 decimal places and round the dollar value to 2 decimal places.) Settle price Dollar value b. What was the settle price for May 2019 natural gas futures on this date? If you held 40 contracts, what is the total dollar value of your futures position? (Input all amounts as positive values. Enter the settle price in dollars rounded to 4 decimal places and round the dollar value to the nearest whole number.) Settle price Dollar value c-1. Suppose you held an open position of 10 June 2019 mini Dow Jones Industrial Average futures on this day. What is the change in the total dollar value of your position for this day's trading? (A negative value should be indicated by a minus sign.) Dollar value FIGURE 14.1 Futures Prices (April 10, 2019) Futures Contracts WSJ.com/commodities Metal & Petroleum Futures Contract Open Open High hi lo Low Settle Chg Interest hilo Low Copper High (CMX)-25,000 lbs.; $ per b. Contract Open High hilo Cotton (ICE-US)-50,000 lbs.: cents per tb. Mav 78,18 78.35 77.32 July 78.73 78.84 78.09 Orange Juice (ICE-US) 15,000 lbs.; cents per lb. April May 2.9225 -0.0090 1,261 2.9255 -0.0085 92,345 2.9325 2.9425 2.9110 oz: $ per troy oz. Gold (CMX) 100 troy Apri 1304.00 1304.00 108.90 109.80 May July 108.20 113.70 114.35 111.85 June Aug Dec 1308.20 1314.70 1314.50 1320.70 1326.50 1332.20 1329.90 1337.00 Apri 1337.30 1343.10 Palladium (NYM)-50 troy oz. $ por troy oz. 1301.50 1309.10 1304.70 1313.00 1311.00 1319.90 1322.80 1331.90 1329.90 1337.90 1334.80 1343.60 5.60 325 5.60 331,311 5.60 50,769 5.60 36,080 2009 5.50 11,597 5.50 6,985 Interest Rate Futures Feb 20 April 1366.40 0.60 1 1355.00 1363.20 0.60 19,677 1349.20 1356.80 1.40 2,205 136260 1371.50 Treasury Bonds (CBT)-$100,000; pts 32nds of 100% June 147-280 148-170 147-230 148-070 Treasury Notes (CBT) $100.000, pls 32nds of 100% Jurk 123-190 123-295 123-170 123-255 Sept 123-305 124-040 123-270 124-015 135640 1361.70 June Sept acp Platinum (NYM)-50 troy oz: S per troy oz. Apri 900.00 900.00 900.00 903.20 890.50 908.90 9.30 67 9.60 69,489 5 Y. Treasury Notes (CBT)-$100,000; pts 32nds of 100% Juri 115 160 115 230 Sept 115-220 115-252 July 896.10 912.80 115-117 115-202 115-202 115-240 Silver (CMX)-5.000 troy oz.; $ par tray az Apri 15.170 15,205 0033 16 0.033 117,796 15.185 15.265 15.095 15.201 May 15.115 15.244 Crude OIL, Light Sweet (NYM)-1000 bbls.; $ per bbl. May 64.70 64.05 64.61 64.71 A 64,01 64.65 64.69 A 63.93 64.67 63.55 64.38 62.57 63.46 58.68 59.28 2 Yr. Treasury Notes (CBT)-$200,000; pts 32nds of 100% June 106 123 106 147 100 122 106-136 30 Day Federal Funds (CBT)-$5,000,000;100-daily avg. April 97.590 97.593 May 97.600 97.600 64.22 64.20 June 97.590 97.590 -.002 97.595 97.595 -.005 July 64.12 0.63 280,173 0.69 321.402 0.76 180,217 0.82 154,891 0.81 199,537 0.56 118,733 Sept 63.72 64.40 A 10 Yr. Del. Int. Rate Swaps (CBT) $100,000; pts 32nds of 100% June 101.106 101.797 101.105 104.641 .188 Dec 62.73 63.17 A Dec 20 58.73 59.29 A 1 Month Libor (CME)-$1300,000; pts of 100% April 97.5225 m NY Harbor ULSD (NYM)-42.000 gal: $ per gal May June 0427 90,825 0412 79,735 2.0510 2.0897 A 2.0488 2.0876 2.0575 2.0010 A 2.0520 2.0892 Gasoline-NY RBOB (NYM)-42,000 ga: $ par gal. May June Eurodollar (CME)-$1000,000; pts of 100% Apri 97.4275 97.4275 Juna 97.4450 97 4550 Sept Dec 2.0105 2.0702 A 1.9850 2.0307 A 2.0105 2.0692 1.9806 2.0297 0702 108,354 0598 103,754 97.4100 97.4175-0125 97.4400 97.4450 0050 97.4850 97.4950 97.5050 97.5200 0050 w 97.4850 97.5050 97.5050 97.5350 Natural Gas (NYM)-10.000 MMBtu: $ per MMBtu. Ma May 2.705 2.779 June 2.749 2768 Currency Futures July 2.686 2.700 001 187,831 2726 2,742 003 167,620 2786 2.801 003 125,811 2813 2.827 001 71,485 2.800 2.821 144.545 2.829 2.842 001 95,014 Aug 2.805 2821 2.832 2.849 2.827 2813 2.849 2861 9015 0010 Sept 9059 0009 Oct Agriculture Futures 7505 7507 7497 7518 0001 May July Corn (CBT) 5,000 bu.; cents per bu. 360.25 362.75 368.75 371.75 360.00 361.75 1.75 553,142 368.79 370.75 2.25 556,095 1.3087 0041 Japanese Yen (CME)-Y12,500,000: $ per 100Y Apri 8998 9016 .8992 June 9047 9070 0034 Canadian Dollar (CME)-CAD 1000,000; $ per CAD Apri 7508 7508 Juna 7514 7528 British Pound (CME)- 62,500; $ per April 1.3054 1.3118 1.3052 June 1.3097 1.3165 1.3093 Swiss Franc (CME) CHF 125,500; $ par CHF June 1.0067 1.0075 1.0000 Sept 1.0122 1.0130 1.01.17 Australian Dollar (CME)-AUD 100,000: $ per AUD Aaril .7116 May 7117 7120 1.3128 0041 Oats (CBT)-5,000 bu; cants par bu May 282.00 282.00 July 274.25 274.75 277.00 279.00 -2.25 3,102 269.75 272.75 -1.00 1,875 1.0038-0031 1.0123-0032 Soybeans (CBT)-5.000 bu.; conts por bu. May July 898.75 903.75 911.50 917.00 897.25 902.00 910.25 915.25 3.25 267,825 3.50 261,722 7116 7164 Soybean Meal (CBT)-100 tons par ton May 7167 0042 .7171 0012 7127 7179 309.10 311.00 308.50 310.10 7133 1.00 142.987 1.00 149.225 7185 7176 0042 July D 312.80 314.70 312.20 313.80 7146 7196 7140 7189 0041 Soybean Oll (CBT)-60,000 lbs: cents per a May .7176 7203 0041 29.02 29.11 29.31 29.41 28.81 29.07 29.12 29.38 .03 127.952 .03 158,428 June Sept Dec March 20 Mexican Peso (CME)-MXN 500,000; $ por MXN April June 7176 7172 7187 7172 .7163 .7216 0041 73. July Rough Rice (CBTI-2000 cut; $per cwb May 103200 1041.50 1021.50 1023.50 -5.50 5,281 1042.00 1048.50 -2.50 2,162 05272 05272 05259 05226 05272 05222 05303 00026 05251 00026 39 234,619 July 1059.00 1061.50 Wheat (CBT)-5000 bu; cents per bu May Juy 459.00 461,75 455.50 458.00 -1.50 158.124 460.00 461.50 -2.50 171,832 Euro (CME)-125.000; $ per April Juna 16375 464.75 1.1271 1.1292 1.1328 1.1360 1.1241 1.1276 0003 1,1294 1.1336 0003 2,387 478,245 Wheat (KC)-5000 bu; cents per bu May July 126.75 430.00 121.50 431.50 426.25 -1.25 117,401 432.75 -2.25 125,262 Index Futures 433.50 436.25 Wheat (MPLS)-5000 bu; cents per bu. May Juy Mini DJ Industrial Average (CBT)-$5x Index June 26144 26233 523.00 533.50 530.25 7.25 21,552 8 523.00 531,00 537.00 78,612 531,00 541.25 5.75 21,816 Cattle-Feeder (CME)-50,000 lbs: cents per b April Aug 145.850 145.925 145.00 145.175 -979 156450 157.025 -575 3,781 18,169 26107 26166 S&P 500 Index (CME)-$250 x Index June 2883.00 2895.50 A 2883.00 2894.50 11.90 28,438 Mini S&P 500 (CME)-$50 x index 2882.00 2895.75 2994 50 2878.00 12.00 2531,776 2887.75 2901.00 2883.50 2899.50 19,300 12.00 157.600 157.750 Cattle-Live (CME)-40,000 lbs.; cents per lb. Apri Juri Sept 125.825 126 325 125.375 125.875 119.600 119.950 -025 23,376 -400 198,207 June 120.150 120 350 Mini S&P Midcap 400 (CME) $100 x Index 1932.20 1951.50 June 1929.00 1949.40 18.30 63,577 78.750 79.125 375 13,520 1.300 82,000 91.000 97.325 Hogs-Lean (CME)-40,000 lbs.; cants par lb. Apri 78.675 78.900 June 93.525 96.450 Lumber (CME)-110,000 bdft. $ per 1,000 bd. ft May July 312 30 311.80 336.00 342.40 345.00 2.10 70 346.30 348.10 340.80 1,880 1,016 Mini Nasdaq 100 (CME)-$20 x Index June 7590.5 7646.0 A 7575.8 7641.3 48.0 200,115 Mini Russell 2000 (ICE-US)-$100 x Index June 1564.50 1586.80 1562.10 1585.80 21.10 435,857 Mini Russell 1000 (ICE-US)-$100 x Index June 1599.70 1603.40 1598.40 1603.00 6.30 96.41 05 MIlk (CME)-200,000 ts: cents par b Apri May 15.94 15.87 15.99 A 15.84 15.06 A 15.97 .02 15.92 07 3,396 3,878 8,979 15.84 US Dollar Index (ICE-US)-$1000 x Index 96.60 96.84 Juna 96.56 49.480 Cocoa (ICE-US)-10 metrictons, $ parton. May July Coffee (ICE-US)-37,500 lbs: cents per lb. 2.439 2449 2,418 2,425 2,421 2,443 -3 21.910 5 88,143 2,399 2.423 93.75 94.50 94.25 .60 90,442 May July 93.10 95.60 96.20 96.95 96.75 .65 115,156 Sugar-World (ICE-US) 112,000 lbs; cents per lb. May 12.78 12.83 Juy 1290 12.99 12.70 12.81 12.81 12.98 .03 230.257 .09 299,102 Sugar-Domestic (ICE-US)-112,000 lbs; cents per tb. Juy 26.99 27.00 Sept 26.65 26.96 26.99 27.00 26.65 27.10 39 44 2,759 2,456 Sources: The Wall Street Journal, April 11, 2019, Dow Jones & Company, Inc. and SIX Financial Information. Open Interest 51,151 81,051 10,496 7,078 7.0 941,582 5.0 3.920,906 6.0 2,121 3.5 1,272,721 4.0 41,922 1.0 3,407,265 222,888 264,957 19,922 15 225,824 1,459,756 1.385,215 1.653.693 2,490 161,102 1,031 141,631 815 139,407 74,074 48 255 312 144,937 670 203 Settle Chg 77.62 -47 78.46 -01 108.60 80 112.20 -1.95 Using Figure 14.1, answer the following questions: a. What was the settle price for April 2019 hogs lean futures on this date? What is the total dollar value of this contract at the close of trading for the day? (Input all amounts as positive values. Enter the settle price in dollars rounded to 4 decimal places and round the dollar value to 2 decimal places.) Settle price Dollar value b. What was the settle price for May 2019 natural gas futures on this date? If you held 40 contracts, what is the total dollar value of your futures position? (Input all amounts as positive values. Enter the settle price in dollars rounded to 4 decimal places and round the dollar value to the nearest whole number.) Settle price Dollar value c-1. Suppose you held an open position of 10 June 2019 mini Dow Jones Industrial Average futures on this day. What is the change in the total dollar value of your position for this day's trading? (A negative value should be indicated by a minus sign.) Dollar value FIGURE 14.1 Futures Prices (April 10, 2019) Futures Contracts WSJ.com/commodities Metal & Petroleum Futures Contract Open Open High hi lo Low Settle Chg Interest hilo Low Copper High (CMX)-25,000 lbs.; $ per b. Contract Open High hilo Cotton (ICE-US)-50,000 lbs.: cents per tb. Mav 78,18 78.35 77.32 July 78.73 78.84 78.09 Orange Juice (ICE-US) 15,000 lbs.; cents per lb. April May 2.9225 -0.0090 1,261 2.9255 -0.0085 92,345 2.9325 2.9425 2.9110 oz: $ per troy oz. Gold (CMX) 100 troy Apri 1304.00 1304.00 108.90 109.80 May July 108.20 113.70 114.35 111.85 June Aug Dec 1308.20 1314.70 1314.50 1320.70 1326.50 1332.20 1329.90 1337.00 Apri 1337.30 1343.10 Palladium (NYM)-50 troy oz. $ por troy oz. 1301.50 1309.10 1304.70 1313.00 1311.00 1319.90 1322.80 1331.90 1329.90 1337.90 1334.80 1343.60 5.60 325 5.60 331,311 5.60 50,769 5.60 36,080 2009 5.50 11,597 5.50 6,985 Interest Rate Futures Feb 20 April 1366.40 0.60 1 1355.00 1363.20 0.60 19,677 1349.20 1356.80 1.40 2,205 136260 1371.50 Treasury Bonds (CBT)-$100,000; pts 32nds of 100% June 147-280 148-170 147-230 148-070 Treasury Notes (CBT) $100.000, pls 32nds of 100% Jurk 123-190 123-295 123-170 123-255 Sept 123-305 124-040 123-270 124-015 135640 1361.70 June Sept acp Platinum (NYM)-50 troy oz: S per troy oz. Apri 900.00 900.00 900.00 903.20 890.50 908.90 9.30 67 9.60 69,489 5 Y. Treasury Notes (CBT)-$100,000; pts 32nds of 100% Juri 115 160 115 230 Sept 115-220 115-252 July 896.10 912.80 115-117 115-202 115-202 115-240 Silver (CMX)-5.000 troy oz.; $ par tray az Apri 15.170 15,205 0033 16 0.033 117,796 15.185 15.265 15.095 15.201 May 15.115 15.244 Crude OIL, Light Sweet (NYM)-1000 bbls.; $ per bbl. May 64.70 64.05 64.61 64.71 A 64,01 64.65 64.69 A 63.93 64.67 63.55 64.38 62.57 63.46 58.68 59.28 2 Yr. Treasury Notes (CBT)-$200,000; pts 32nds of 100% June 106 123 106 147 100 122 106-136 30 Day Federal Funds (CBT)-$5,000,000;100-daily avg. April 97.590 97.593 May 97.600 97.600 64.22 64.20 June 97.590 97.590 -.002 97.595 97.595 -.005 July 64.12 0.63 280,173 0.69 321.402 0.76 180,217 0.82 154,891 0.81 199,537 0.56 118,733 Sept 63.72 64.40 A 10 Yr. Del. Int. Rate Swaps (CBT) $100,000; pts 32nds of 100% June 101.106 101.797 101.105 104.641 .188 Dec 62.73 63.17 A Dec 20 58.73 59.29 A 1 Month Libor (CME)-$1300,000; pts of 100% April 97.5225 m NY Harbor ULSD (NYM)-42.000 gal: $ per gal May June 0427 90,825 0412 79,735 2.0510 2.0897 A 2.0488 2.0876 2.0575 2.0010 A 2.0520 2.0892 Gasoline-NY RBOB (NYM)-42,000 ga: $ par gal. May June Eurodollar (CME)-$1000,000; pts of 100% Apri 97.4275 97.4275 Juna 97.4450 97 4550 Sept Dec 2.0105 2.0702 A 1.9850 2.0307 A 2.0105 2.0692 1.9806 2.0297 0702 108,354 0598 103,754 97.4100 97.4175-0125 97.4400 97.4450 0050 97.4850 97.4950 97.5050 97.5200 0050 w 97.4850 97.5050 97.5050 97.5350 Natural Gas (NYM)-10.000 MMBtu: $ per MMBtu. Ma May 2.705 2.779 June 2.749 2768 Currency Futures July 2.686 2.700 001 187,831 2726 2,742 003 167,620 2786 2.801 003 125,811 2813 2.827 001 71,485 2.800 2.821 144.545 2.829 2.842 001 95,014 Aug 2.805 2821 2.832 2.849 2.827 2813 2.849 2861 9015 0010 Sept 9059 0009 Oct Agriculture Futures 7505 7507 7497 7518 0001 May July Corn (CBT) 5,000 bu.; cents per bu. 360.25 362.75 368.75 371.75 360.00 361.75 1.75 553,142 368.79 370.75 2.25 556,095 1.3087 0041 Japanese Yen (CME)-Y12,500,000: $ per 100Y Apri 8998 9016 .8992 June 9047 9070 0034 Canadian Dollar (CME)-CAD 1000,000; $ per CAD Apri 7508 7508 Juna 7514 7528 British Pound (CME)- 62,500; $ per April 1.3054 1.3118 1.3052 June 1.3097 1.3165 1.3093 Swiss Franc (CME) CHF 125,500; $ par CHF June 1.0067 1.0075 1.0000 Sept 1.0122 1.0130 1.01.17 Australian Dollar (CME)-AUD 100,000: $ per AUD Aaril .7116 May 7117 7120 1.3128 0041 Oats (CBT)-5,000 bu; cants par bu May 282.00 282.00 July 274.25 274.75 277.00 279.00 -2.25 3,102 269.75 272.75 -1.00 1,875 1.0038-0031 1.0123-0032 Soybeans (CBT)-5.000 bu.; conts por bu. May July 898.75 903.75 911.50 917.00 897.25 902.00 910.25 915.25 3.25 267,825 3.50 261,722 7116 7164 Soybean Meal (CBT)-100 tons par ton May 7167 0042 .7171 0012 7127 7179 309.10 311.00 308.50 310.10 7133 1.00 142.987 1.00 149.225 7185 7176 0042 July D 312.80 314.70 312.20 313.80 7146 7196 7140 7189 0041 Soybean Oll (CBT)-60,000 lbs: cents per a May .7176 7203 0041 29.02 29.11 29.31 29.41 28.81 29.07 29.12 29.38 .03 127.952 .03 158,428 June Sept Dec March 20 Mexican Peso (CME)-MXN 500,000; $ por MXN April June 7176 7172 7187 7172 .7163 .7216 0041 73. July Rough Rice (CBTI-2000 cut; $per cwb May 103200 1041.50 1021.50 1023.50 -5.50 5,281 1042.00 1048.50 -2.50 2,162 05272 05272 05259 05226 05272 05222 05303 00026 05251 00026 39 234,619 July 1059.00 1061.50 Wheat (CBT)-5000 bu; cents per bu May Juy 459.00 461,75 455.50 458.00 -1.50 158.124 460.00 461.50 -2.50 171,832 Euro (CME)-125.000; $ per April Juna 16375 464.75 1.1271 1.1292 1.1328 1.1360 1.1241 1.1276 0003 1,1294 1.1336 0003 2,387 478,245 Wheat (KC)-5000 bu; cents per bu May July 126.75 430.00 121.50 431.50 426.25 -1.25 117,401 432.75 -2.25 125,262 Index Futures 433.50 436.25 Wheat (MPLS)-5000 bu; cents per bu. May Juy Mini DJ Industrial Average (CBT)-$5x Index June 26144 26233 523.00 533.50 530.25 7.25 21,552 8 523.00 531,00 537.00 78,612 531,00 541.25 5.75 21,816 Cattle-Feeder (CME)-50,000 lbs: cents per b April Aug 145.850 145.925 145.00 145.175 -979 156450 157.025 -575 3,781 18,169 26107 26166 S&P 500 Index (CME)-$250 x Index June 2883.00 2895.50 A 2883.00 2894.50 11.90 28,438 Mini S&P 500 (CME)-$50 x index 2882.00 2895.75 2994 50 2878.00 12.00 2531,776 2887.75 2901.00 2883.50 2899.50 19,300 12.00 157.600 157.750 Cattle-Live (CME)-40,000 lbs.; cents per lb. Apri Juri Sept 125.825 126 325 125.375 125.875 119.600 119.950 -025 23,376 -400 198,207 June 120.150 120 350 Mini S&P Midcap 400 (CME) $100 x Index 1932.20 1951.50 June 1929.00 1949.40 18.30 63,577 78.750 79.125 375 13,520 1.300 82,000 91.000 97.325 Hogs-Lean (CME)-40,000 lbs.; cants par lb. Apri 78.675 78.900 June 93.525 96.450 Lumber (CME)-110,000 bdft. $ per 1,000 bd. ft May July 312 30 311.80 336.00 342.40 345.00 2.10 70 346.30 348.10 340.80 1,880 1,016 Mini Nasdaq 100 (CME)-$20 x Index June 7590.5 7646.0 A 7575.8 7641.3 48.0 200,115 Mini Russell 2000 (ICE-US)-$100 x Index June 1564.50 1586.80 1562.10 1585.80 21.10 435,857 Mini Russell 1000 (ICE-US)-$100 x Index June 1599.70 1603.40 1598.40 1603.00 6.30 96.41 05 MIlk (CME)-200,000 ts: cents par b Apri May 15.94 15.87 15.99 A 15.84 15.06 A 15.97 .02 15.92 07 3,396 3,878 8,979 15.84 US Dollar Index (ICE-US)-$1000 x Index 96.60 96.84 Juna 96.56 49.480 Cocoa (ICE-US)-10 metrictons, $ parton. May July Coffee (ICE-US)-37,500 lbs: cents per lb. 2.439 2449 2,418 2,425 2,421 2,443 -3 21.910 5 88,143 2,399 2.423 93.75 94.50 94.25 .60 90,442 May July 93.10 95.60 96.20 96.95 96.75 .65 115,156 Sugar-World (ICE-US) 112,000 lbs; cents per lb. May 12.78 12.83 Juy 1290 12.99 12.70 12.81 12.81 12.98 .03 230.257 .09 299,102 Sugar-Domestic (ICE-US)-112,000 lbs; cents per tb. Juy 26.99 27.00 Sept 26.65 26.96 26.99 27.00 26.65 27.10 39 44 2,759 2,456 Sources: The Wall Street Journal, April 11, 2019, Dow Jones & Company, Inc. and SIX Financial Information. Open Interest 51,151 81,051 10,496 7,078 7.0 941,582 5.0 3.920,906 6.0 2,121 3.5 1,272,721 4.0 41,922 1.0 3,407,265 222,888 264,957 19,922 15 225,824 1,459,756 1.385,215 1.653.693 2,490 161,102 1,031 141,631 815 139,407 74,074 48 255 312 144,937 670 203 Settle Chg 77.62 -47 78.46 -01 108.60 80 112.20 -1.95