

Answered step by step
Verified Expert Solution
Question
1 Approved Answer
Using Figure 14.1 You are long 60 July 2019 soybean oil futures contracts. Calculate your dollar profit or loss from this trading day (A negative
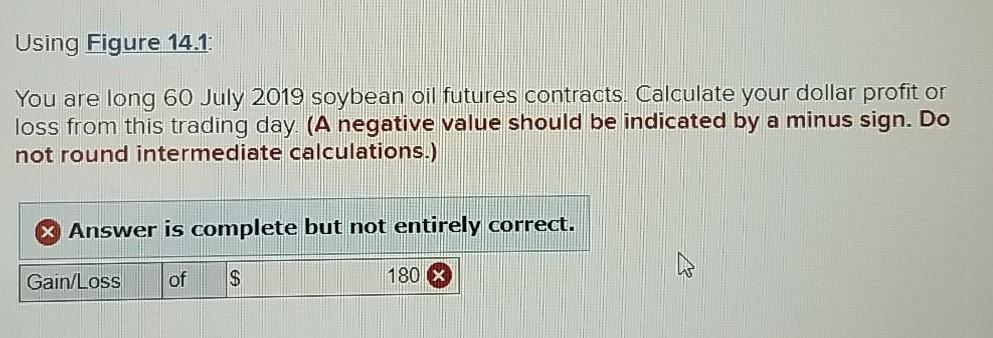
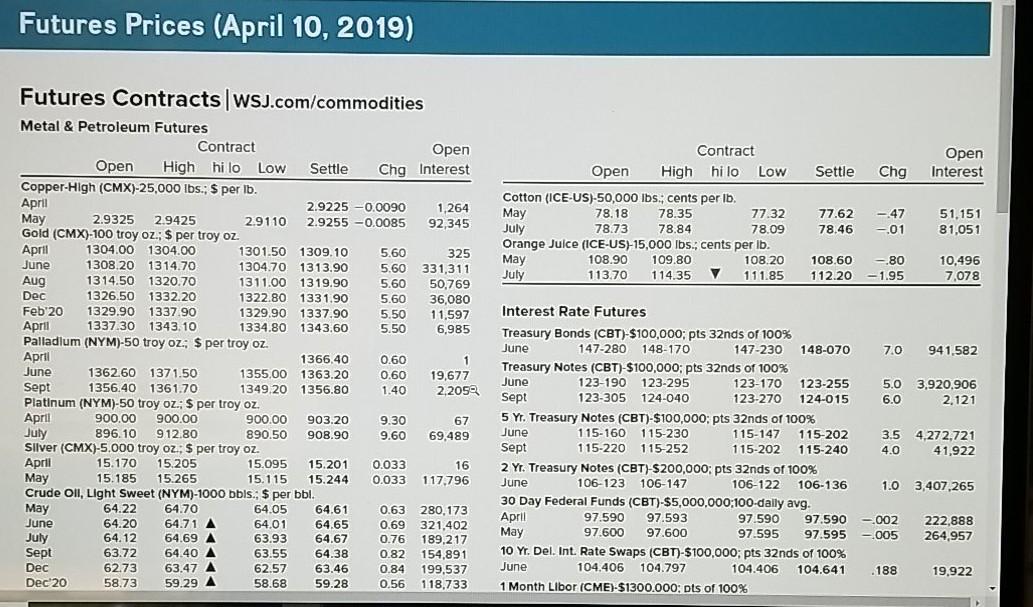
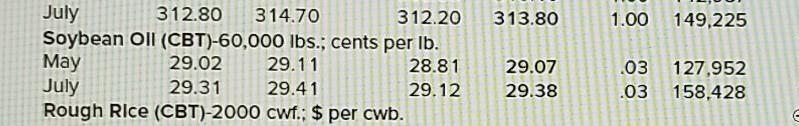
Using Figure 14.1 You are long 60 July 2019 soybean oil futures contracts. Calculate your dollar profit or loss from this trading day (A negative value should be indicated by a minus sign. Do not round intermediate calculations.) Answer is complete but not entirely correct. Gain/Loss of $ 180 X Futures Prices (April 10, 2019) Open Settle Chg Interest Contract Open High hilo Low Cotton (ICE-US)-50,000 lbs.: cents per lb. May 78.18 78.35 77.32 July 78.73 78.84 78.09 Orange Juice (ICE-US)-15,000 lbs., cents per lb. May 108.90 109.80 108.20 July 113.70 114.35 V 111.85 77.62 - 47 51.151 78.46 -01 81,051 108.60 -.80 112.20 -1.95 10,496 7,078 Futures Contracts | WSJ.com/commodities Metal & Petroleum Futures Contract Open Open High hilo Low Settle Chg Interest Copper-High (CMX)-25,000 lbs.: S per Ib. April 2.9225 -0.0090 1,264 May 2.9325 2.9425 2.9110 2.9255 -0.0085 92,345 Gold (CMX)-100 troy oz.: $ per troy oz. April 1304.00 1304.00 1301.50 1309.10 5.60 325 June 1308.201314.70 1304.70 1313.90 5.60 331,311 Aug 1314.50 1320.70 1311.00 1319.90 5.60 50,769 Dec 1326.50 1332.20 1322.80 1331.90 5.60 36,080 Feb 20 1329.90 1337.90 1329.90 1337.90 5.50 11,597 April 1337.30 1343.10 1334.80 1343.60 5.50 6,985 Palladium (NYM)-50 troy oz: $ per troy oz. April 1366.40 0.60 1 June 1362.60 1371.50 1355,00 1363.20 0.60 19,677 Sept 1356.40 1361.70 1349 20 1356.80 1.40 2,2050 Platinum (NYM)-50 troy oz: $ per troy oz. April 900.00 900.00 900.00 903.20 9.30 67 July 896.10 912.80 890.50 908.90 9.60 69,489 Silver (CMX)-5.000 troy oz. $ per troy oz. April 15.170 15.205 15.095 15.201 0.033 16 May 15.185 15.265 15.115 5.244 0.033 117.796 Crude Oil, Light Sweet (NYM)-1000 bols.: $ per bbl. May 64.22 64.70 64.05 64.61 0.63 280,173 June 64.20 64.71 A 64.01 64.65 0.69 321,402 July 64.12 64.69 A 63.93 64.67 0.76 189,217 Sept 63.72 64.40 A 63.55 64.38 0.82 154,891 Dec 62.73 63.47 A 62.57 63.46 0.84 199,537 Dec 20 58.73 59.29 A 58.68 59.28 0.56 118,733 Interest Rate Futures Treasury Bonds (CBT)-$100,000; pts 32nds of 100% June 147-280 148-170 147-230 148-070 7.0 941.582 Treasury Notes (CBT)-$100,000: pts 32nds of 100% June 123-190 123-295 123-170 123-255 5.0 3.920,906 Sept 123-305 124-040 123-270 124-015 6.0 2.121 5 Y. Treasury Notes (CBT)-$100,000: pts 32nds of 100% June 115-160 115-230 115-147 15-202 3,5 4,272,721 Sept 115-220 115-252 115-202 115-240 4.0 41,922 2 Yr. Treasury Notes (CBT)-$200,000; pts 32nds of 100% June 106-123 106-147 106-122 106-136 1.0 3,407,265 30 Day Federal Funds (CBT)-$5,000,000:100-daily avg. April 97.590 97.593 97.590 97.590-002 222,888 May 97.600 97.600 97.595 97.595-005 264,957 10 Yr. Del. Int. Rate Swaps (CBT)-$100,000; pts 32nds of 100% June 104.406 104.797 104.406 104.641 .188 19.922 1 Month Libor (CME)-$1300.000: pts of 100% 313.80 1.00 149,225 July 312.80 314.70 312.20 Soybean Oll (CBT)-60,000 lbs.; cents per lb. May 29.02 29.11 28.81 July 29.31 29.41 29.12 Rough Rice (CBT)-2000 cwf.: $ per cwb. 29.07 29.38 .03 127,952 .03 158,428
Step by Step Solution
There are 3 Steps involved in it
Step: 1

Get Instant Access to Expert-Tailored Solutions
See step-by-step solutions with expert insights and AI powered tools for academic success
Step: 2

Step: 3
Ace Your Homework with AI
Get the answers you need in no time with our AI-driven, step-by-step assistance
Get Started
Wealth Mastery Unveiled By Marcus M Dawson A Millennial S Guide To Financial Freedom And Success
Authors: Marcus M. Dawson
1st Edition
979-8865054313