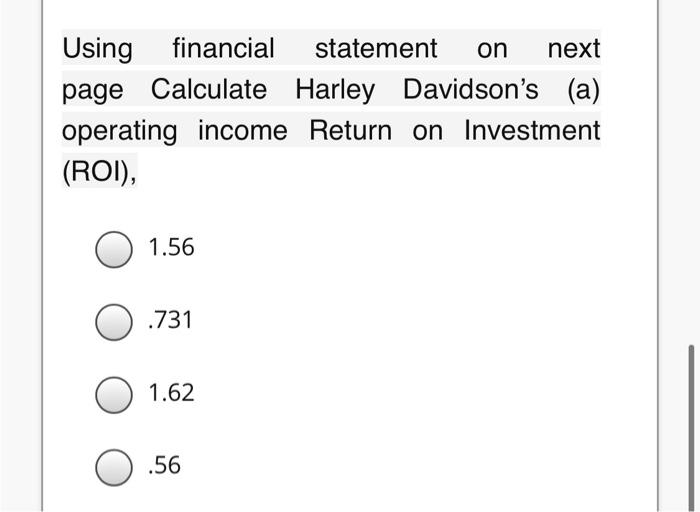
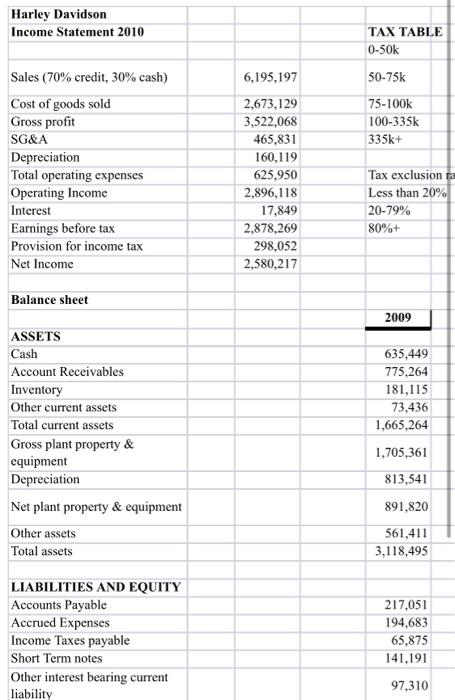
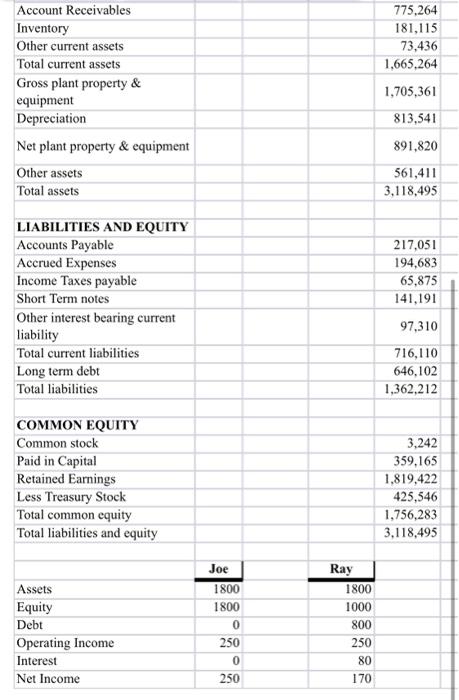
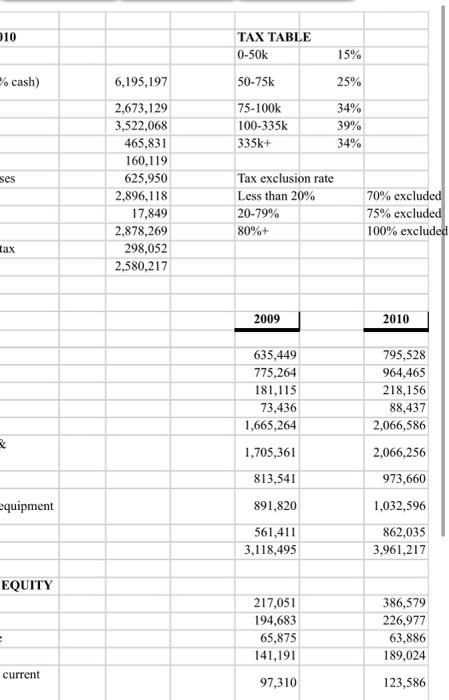
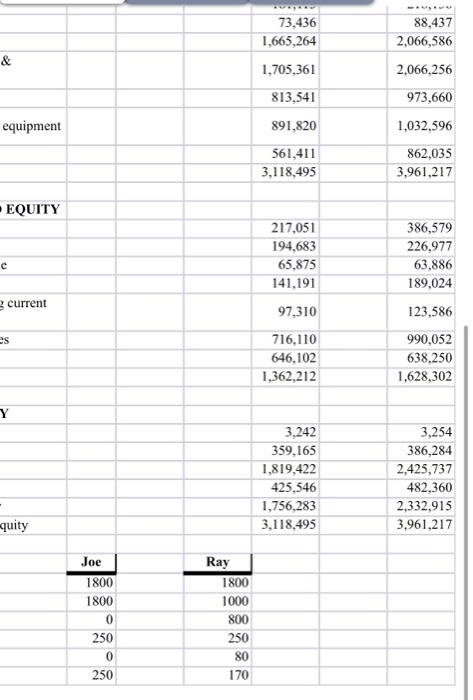
Using financial statement on next page Calculate Harley Davidson's (a) operating income Return on Investment (ROI), 1.56 .731 1.62 .56 Harley Davidson Income Statement 2010 TAX TABLE 0-50k 50-75k 75-100k 100-335k 335k+ Sales (70% credit, 30% cash) Cost of goods sold Gross profit SG&A Depreciation Total operating expenses Operating Income Interest Earnings before tax Provision for income tax Net Income 6,195,197 2,673,129 3,522,068 465,831 160,119 625,950 2.896,118 17,849 2,878,269 298,052 2,580,217 Tax exclusion Less than 20% 20-79% 80%+ Balance sheet 2009 ASSETS Cash Account Receivables Inventory Other current assets Total current assets Gross plant property & equipment Depreciation Net plant property & equipment Other assets Total assets 635,449 775,264 181,115 73,436 1,665,264 1,705,361 813,541 891,820 561,411 3,118,495 LIABILITIES AND EQUITY Accounts Payable Accrued Expenses Income Taxes payable Short Term notes Other interest bearing current liability 217,051 194,683 65,875 141,191 97,310 775,264 181,115 73,436 1.665,264 1,705,361 Account Receivables Inventory Other current assets Total current assets Gross plant property & equipment Depreciation Net plant property & equipment Other assets Total assets 813,541 891,820 561,411 3,118,495 217,051 194,683 65,875 141,191 LIABILITIES AND EQUITY Accounts Payable Accrued Expenses Income Taxes payable Short Term notes Other interest bearing current liability Total current liabilities Long term debt Total liabilities 97,310 716,110 646,102 1,362,212 COMMON EQUITY Common stock Paid in Capital Retained Earnings Less Treasury Stock Total common equity Total liabilities and equity 3,242 359,165 1,819,422 425,546 1,756,283 3,118,495 Joe Assets Equity Debt Ray 1800 1000 800 250 80 170 1800 1800 0 250 0 250 Operating Income Interest Net Income 10 TAX TABLE 0-50k 15% % cash) 50-75k 25% 75-100k 100-335k 335k+ 34% 39% 34% ses 6,195,197 2,673,129 3,522,068 465,831 160,119 625,950 2,896,118 17,849 2,878,269 298,052 2,580,217 Tax exclusion rate Less than 20% 20-79% 80%+ 70% excluded 75% excluded 100% excluded tax 2009 2010 635,449 775,264 181,115 73,436 1,665,264 1,705,361 813,541 795,528 964,465 218,156 88,437 2,066,586 2,066,256 973,660 equipment 891,820 1,032,596 561,411 3,118,495 862,035 3,961,217 EQUITY 217,051 194,683 65,875 141,191 386,579 226,977 63,886 189,024 - current 97,310 123,586 73,436 1,665,264 88,437 2,066,586 & 2,066,256 1,705,361 813,541 973,660 equipment 891,820 561,411 3,118,495 1,032,596 862,035 3,961,217 EQUITY 217,051 194,683 65,875 141,191 e 3 current 386,579 226,977 63,886 189,024 123,586 990,052 638,250 1,628,302 97,310 es 716,110 646,102 1,362,212 Y 3,254 3.242 359,165 1,819,422 425,546 1,756,283 3,118,495 386,284 2,425,737 482,360 2,332,915 3,961,217 - quity Joe 1800 1800 0 250 0 250 Ray 1800 1000 800 250 80 170
