Using fiscal year financial data from 2012 to 2015, how would the adquisition affect Tesla's liquidity risk and financial leverage? Please calculate the following ratios
Using fiscal year financial data from 2012 to 2015, how would the adquisition affect Tesla's liquidity risk and financial leverage?
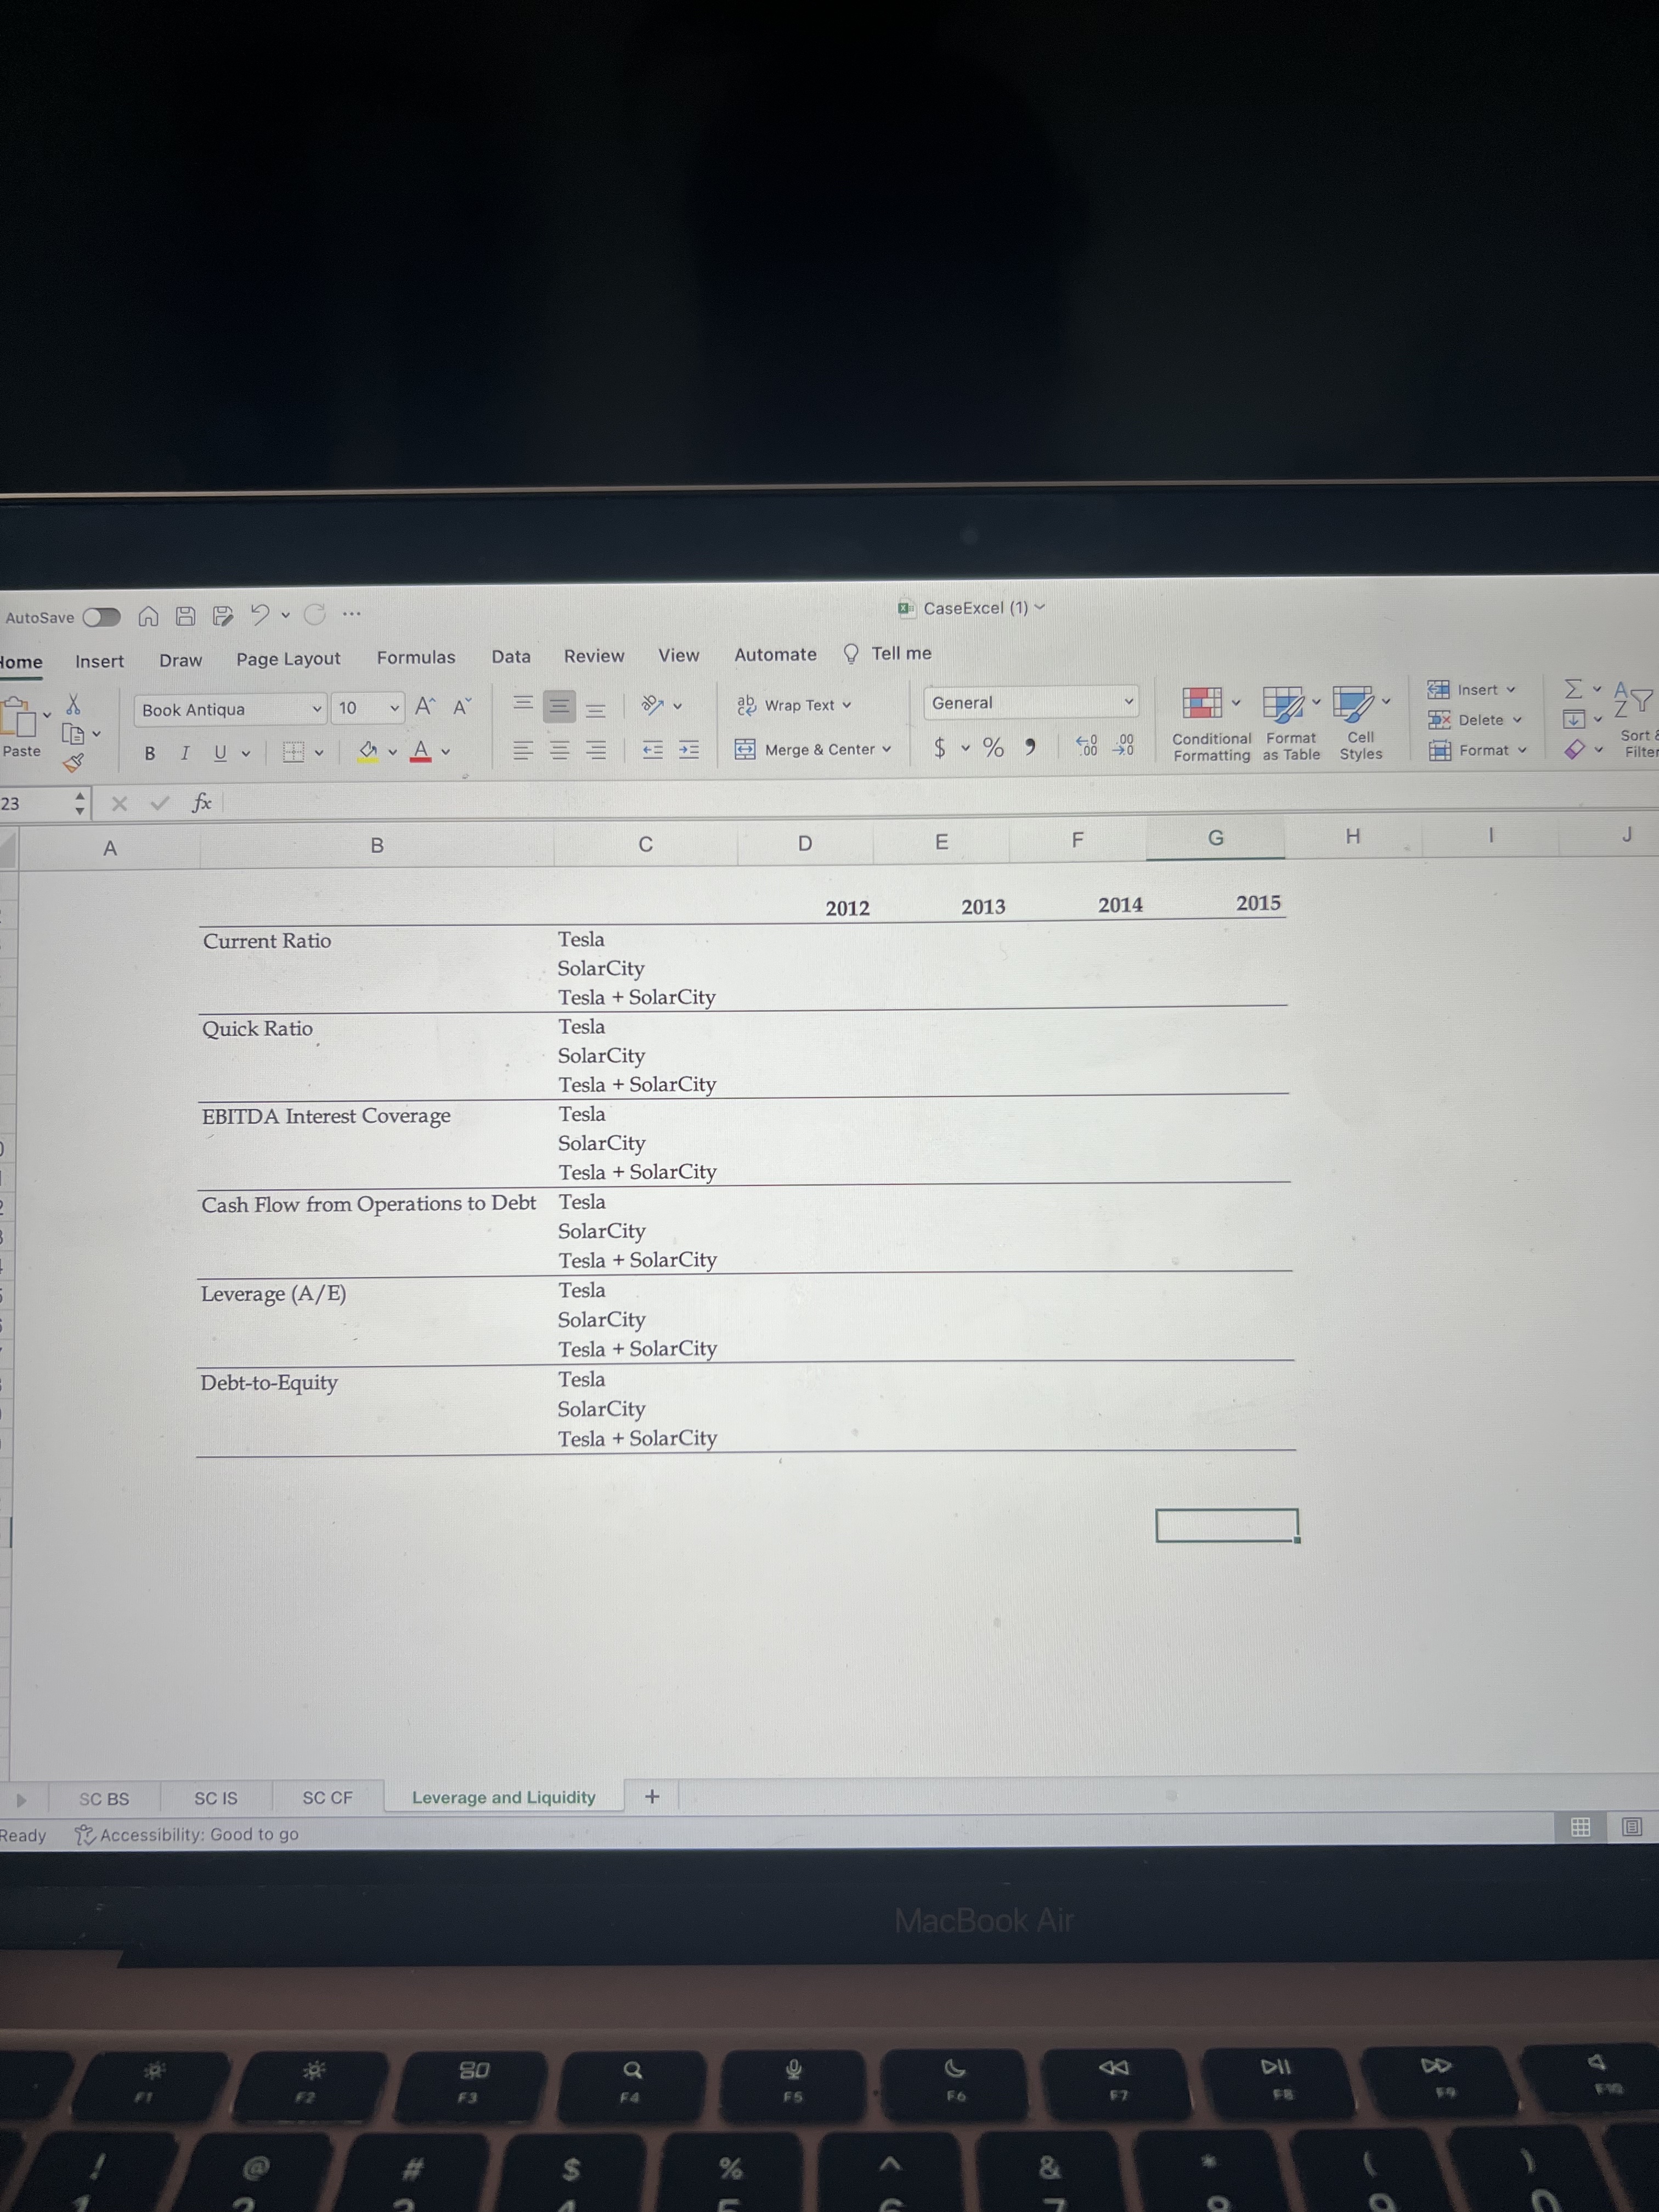
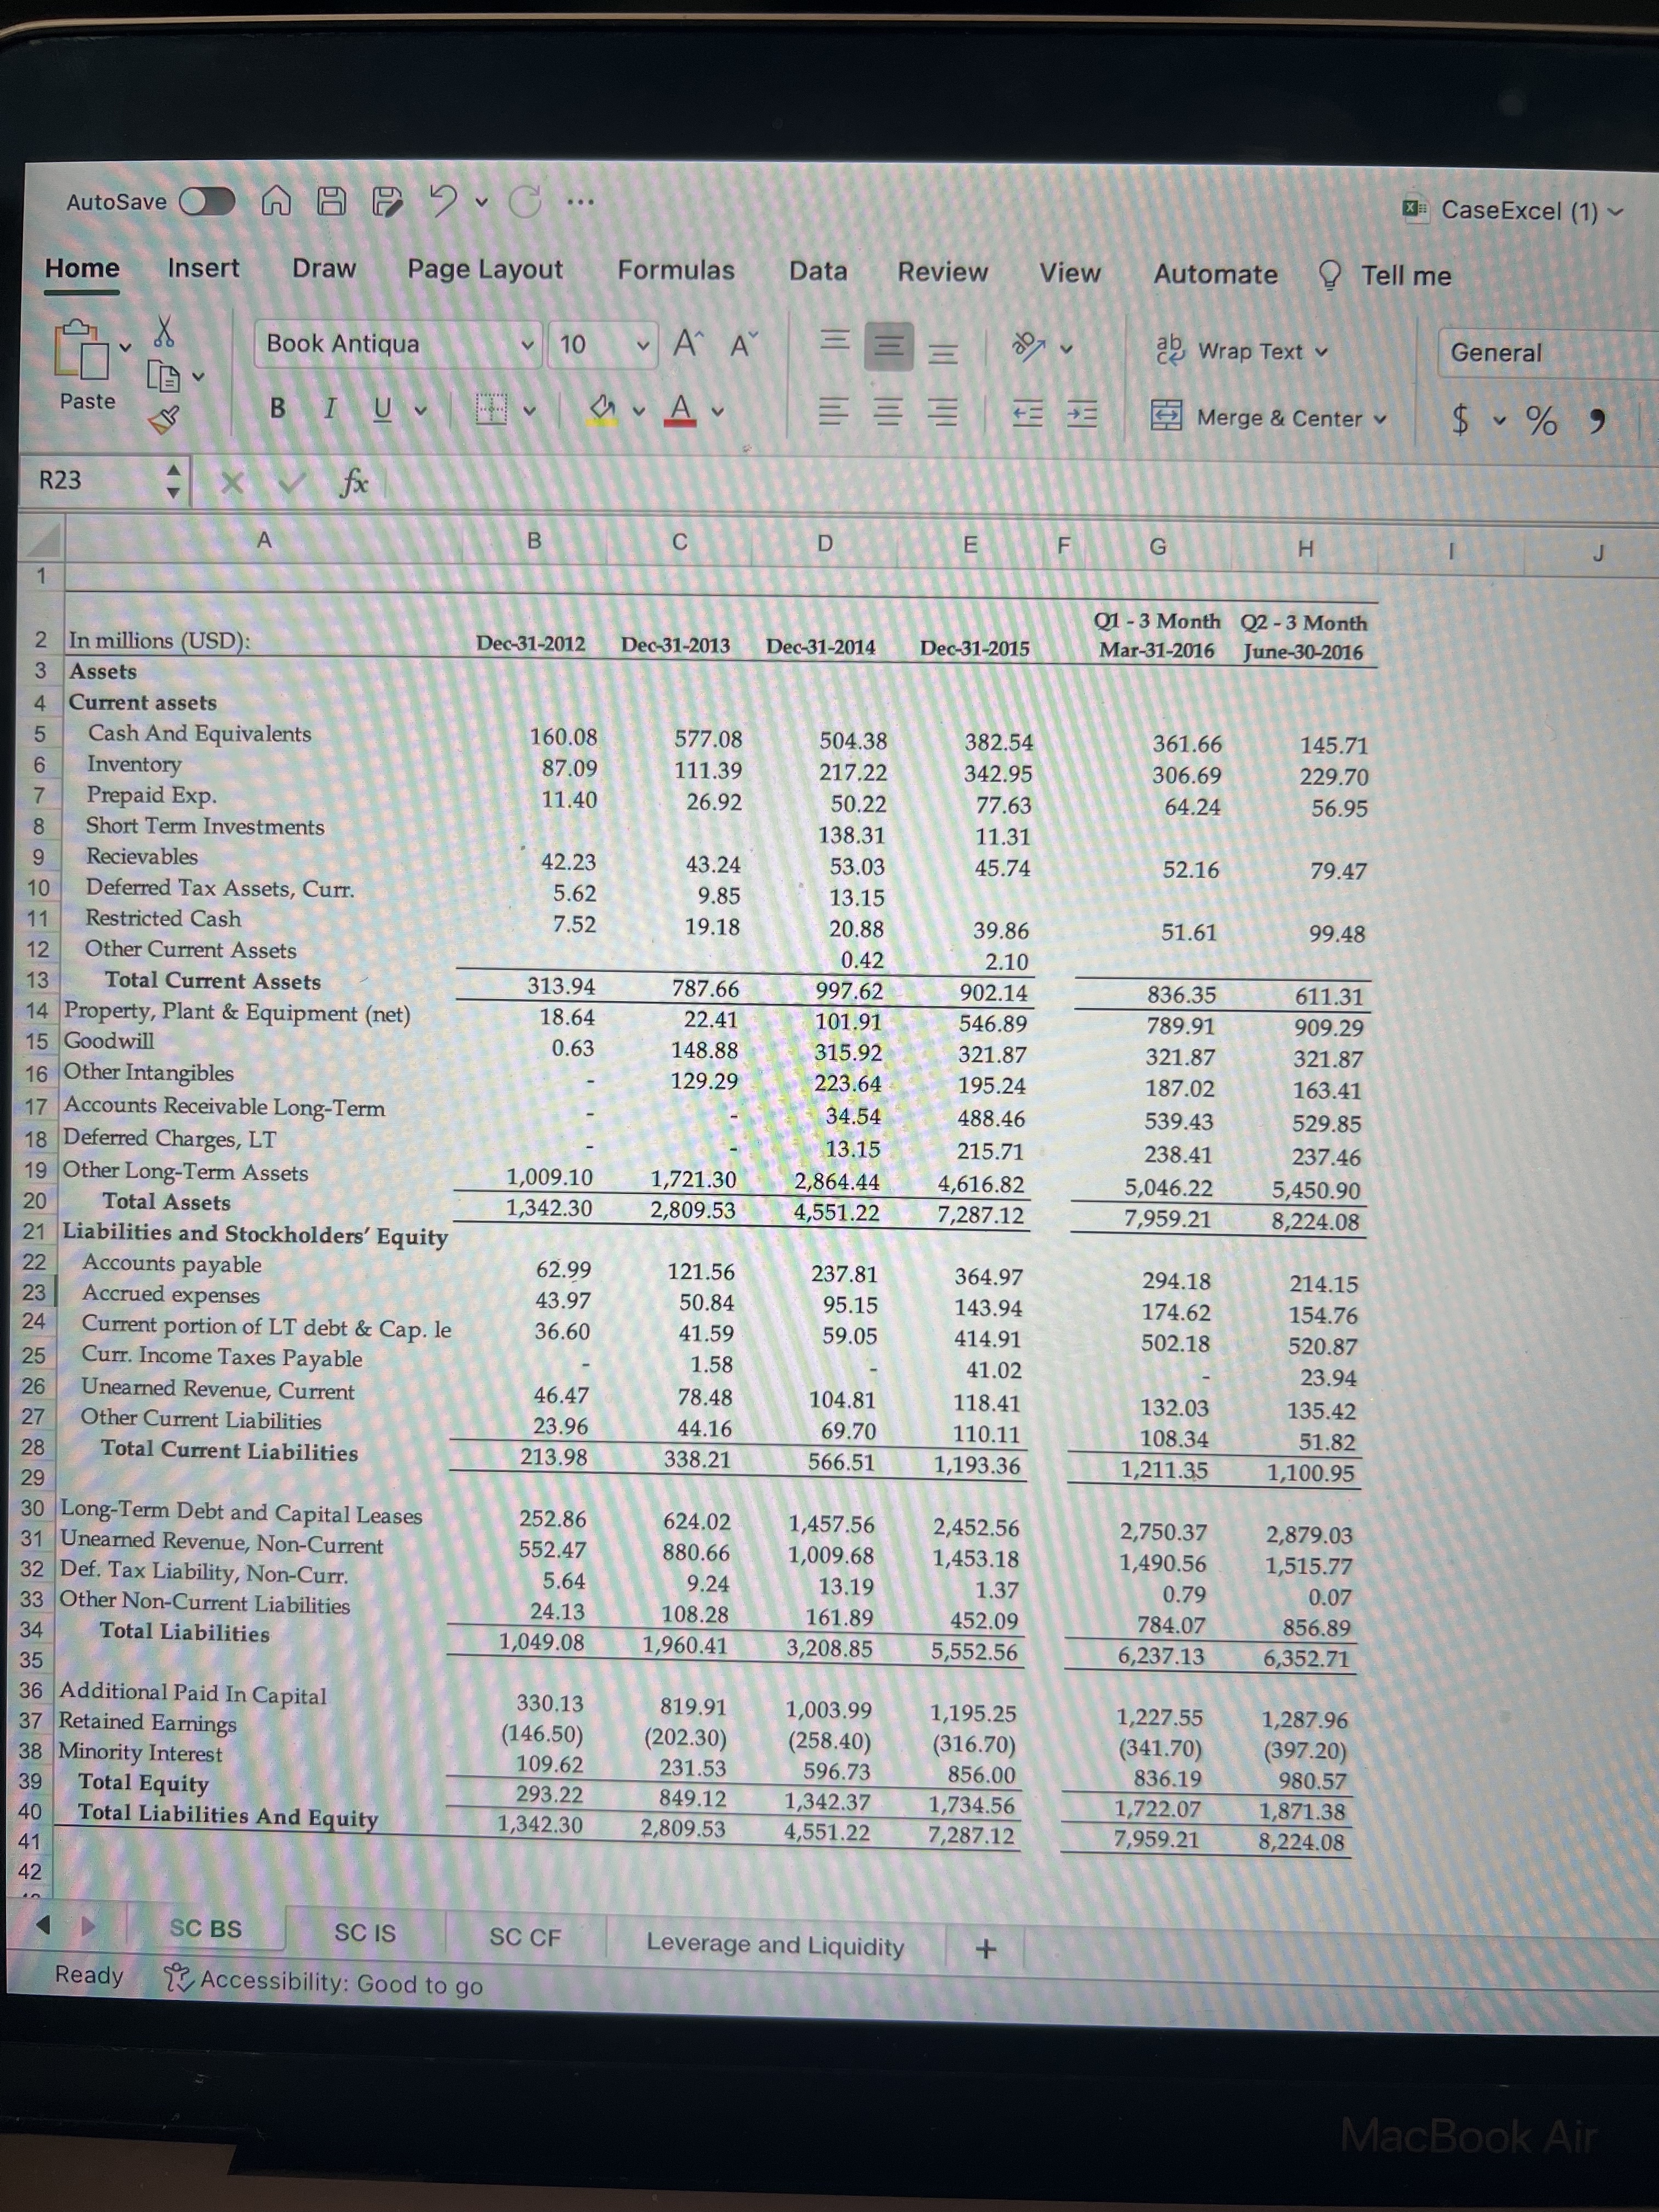
Please calculate the following ratios for (1) Tesla, (2) SolarCity, and (Tesla + SolarCity) for fiscal year end of 2012, 2013, 2014, and 2015 using excel. (Complete the excel sheet "Leverage and Liquidity" Current Ratio
Quick Ratio
EBITDA Interest Coverage (EBITDA/(Int Income and Int Exp)
Cash Flow from Operations to Debt
Leverage (Assets/Equity)
Debt-to-Equity
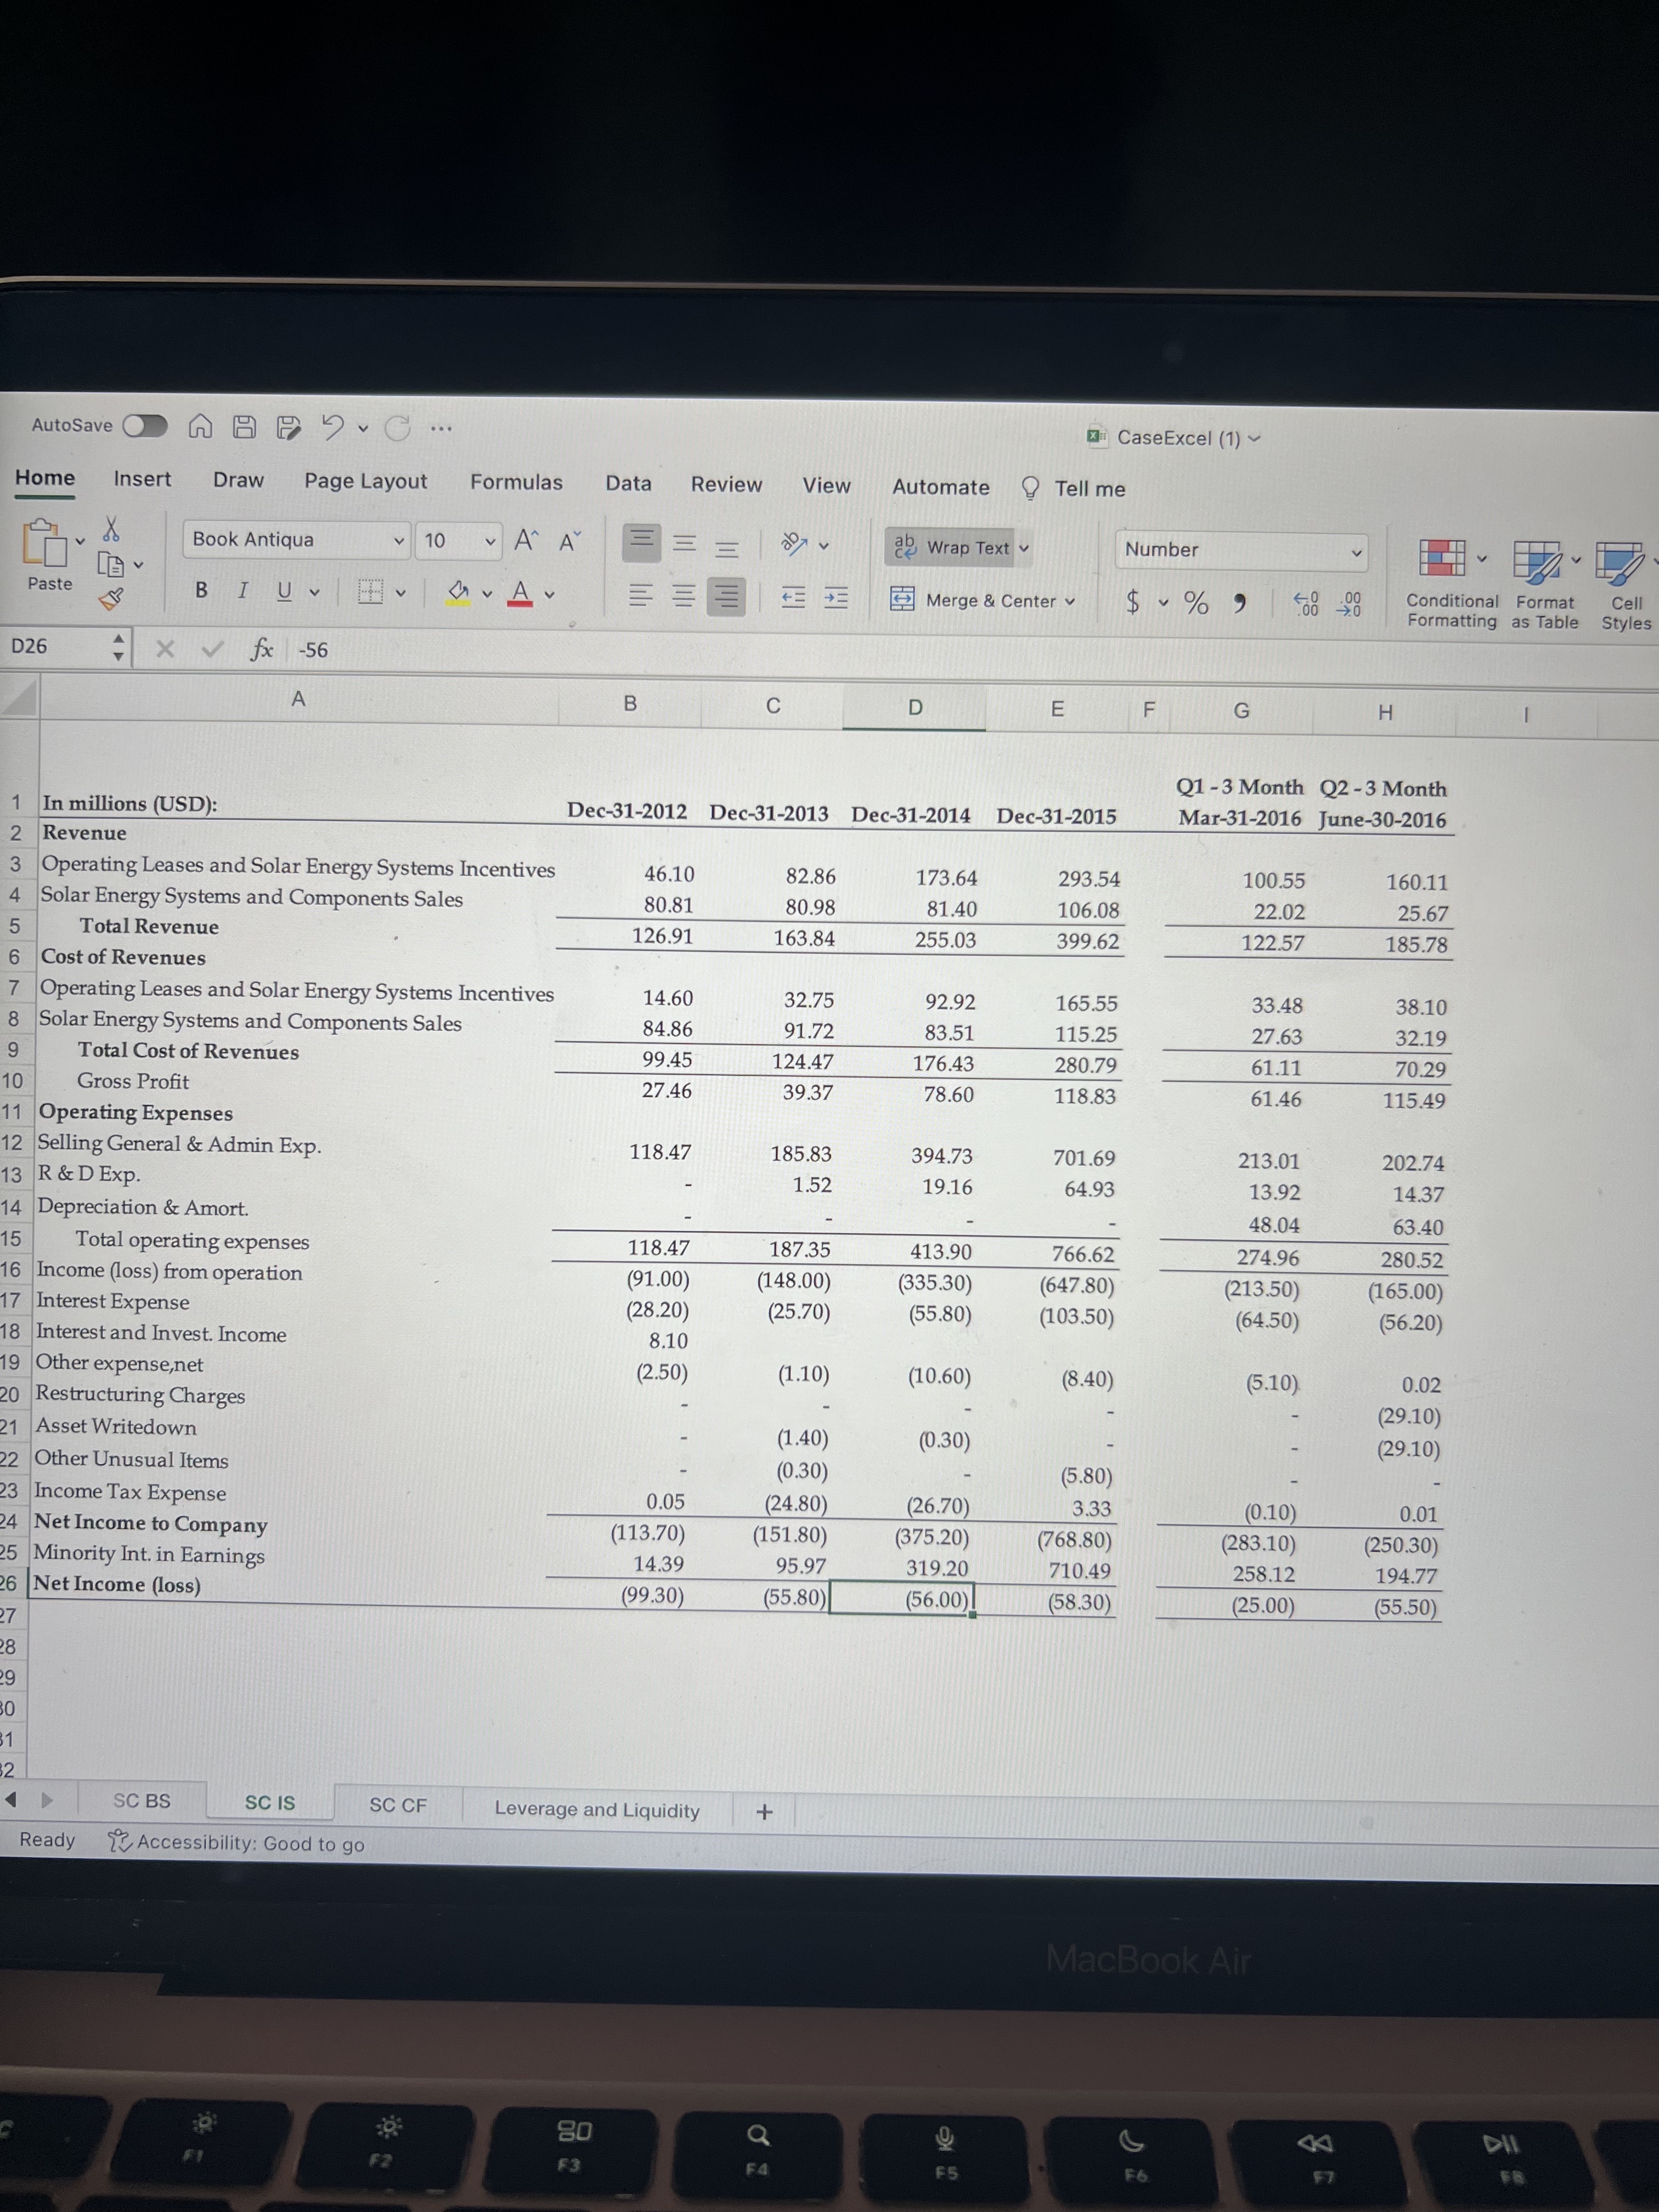
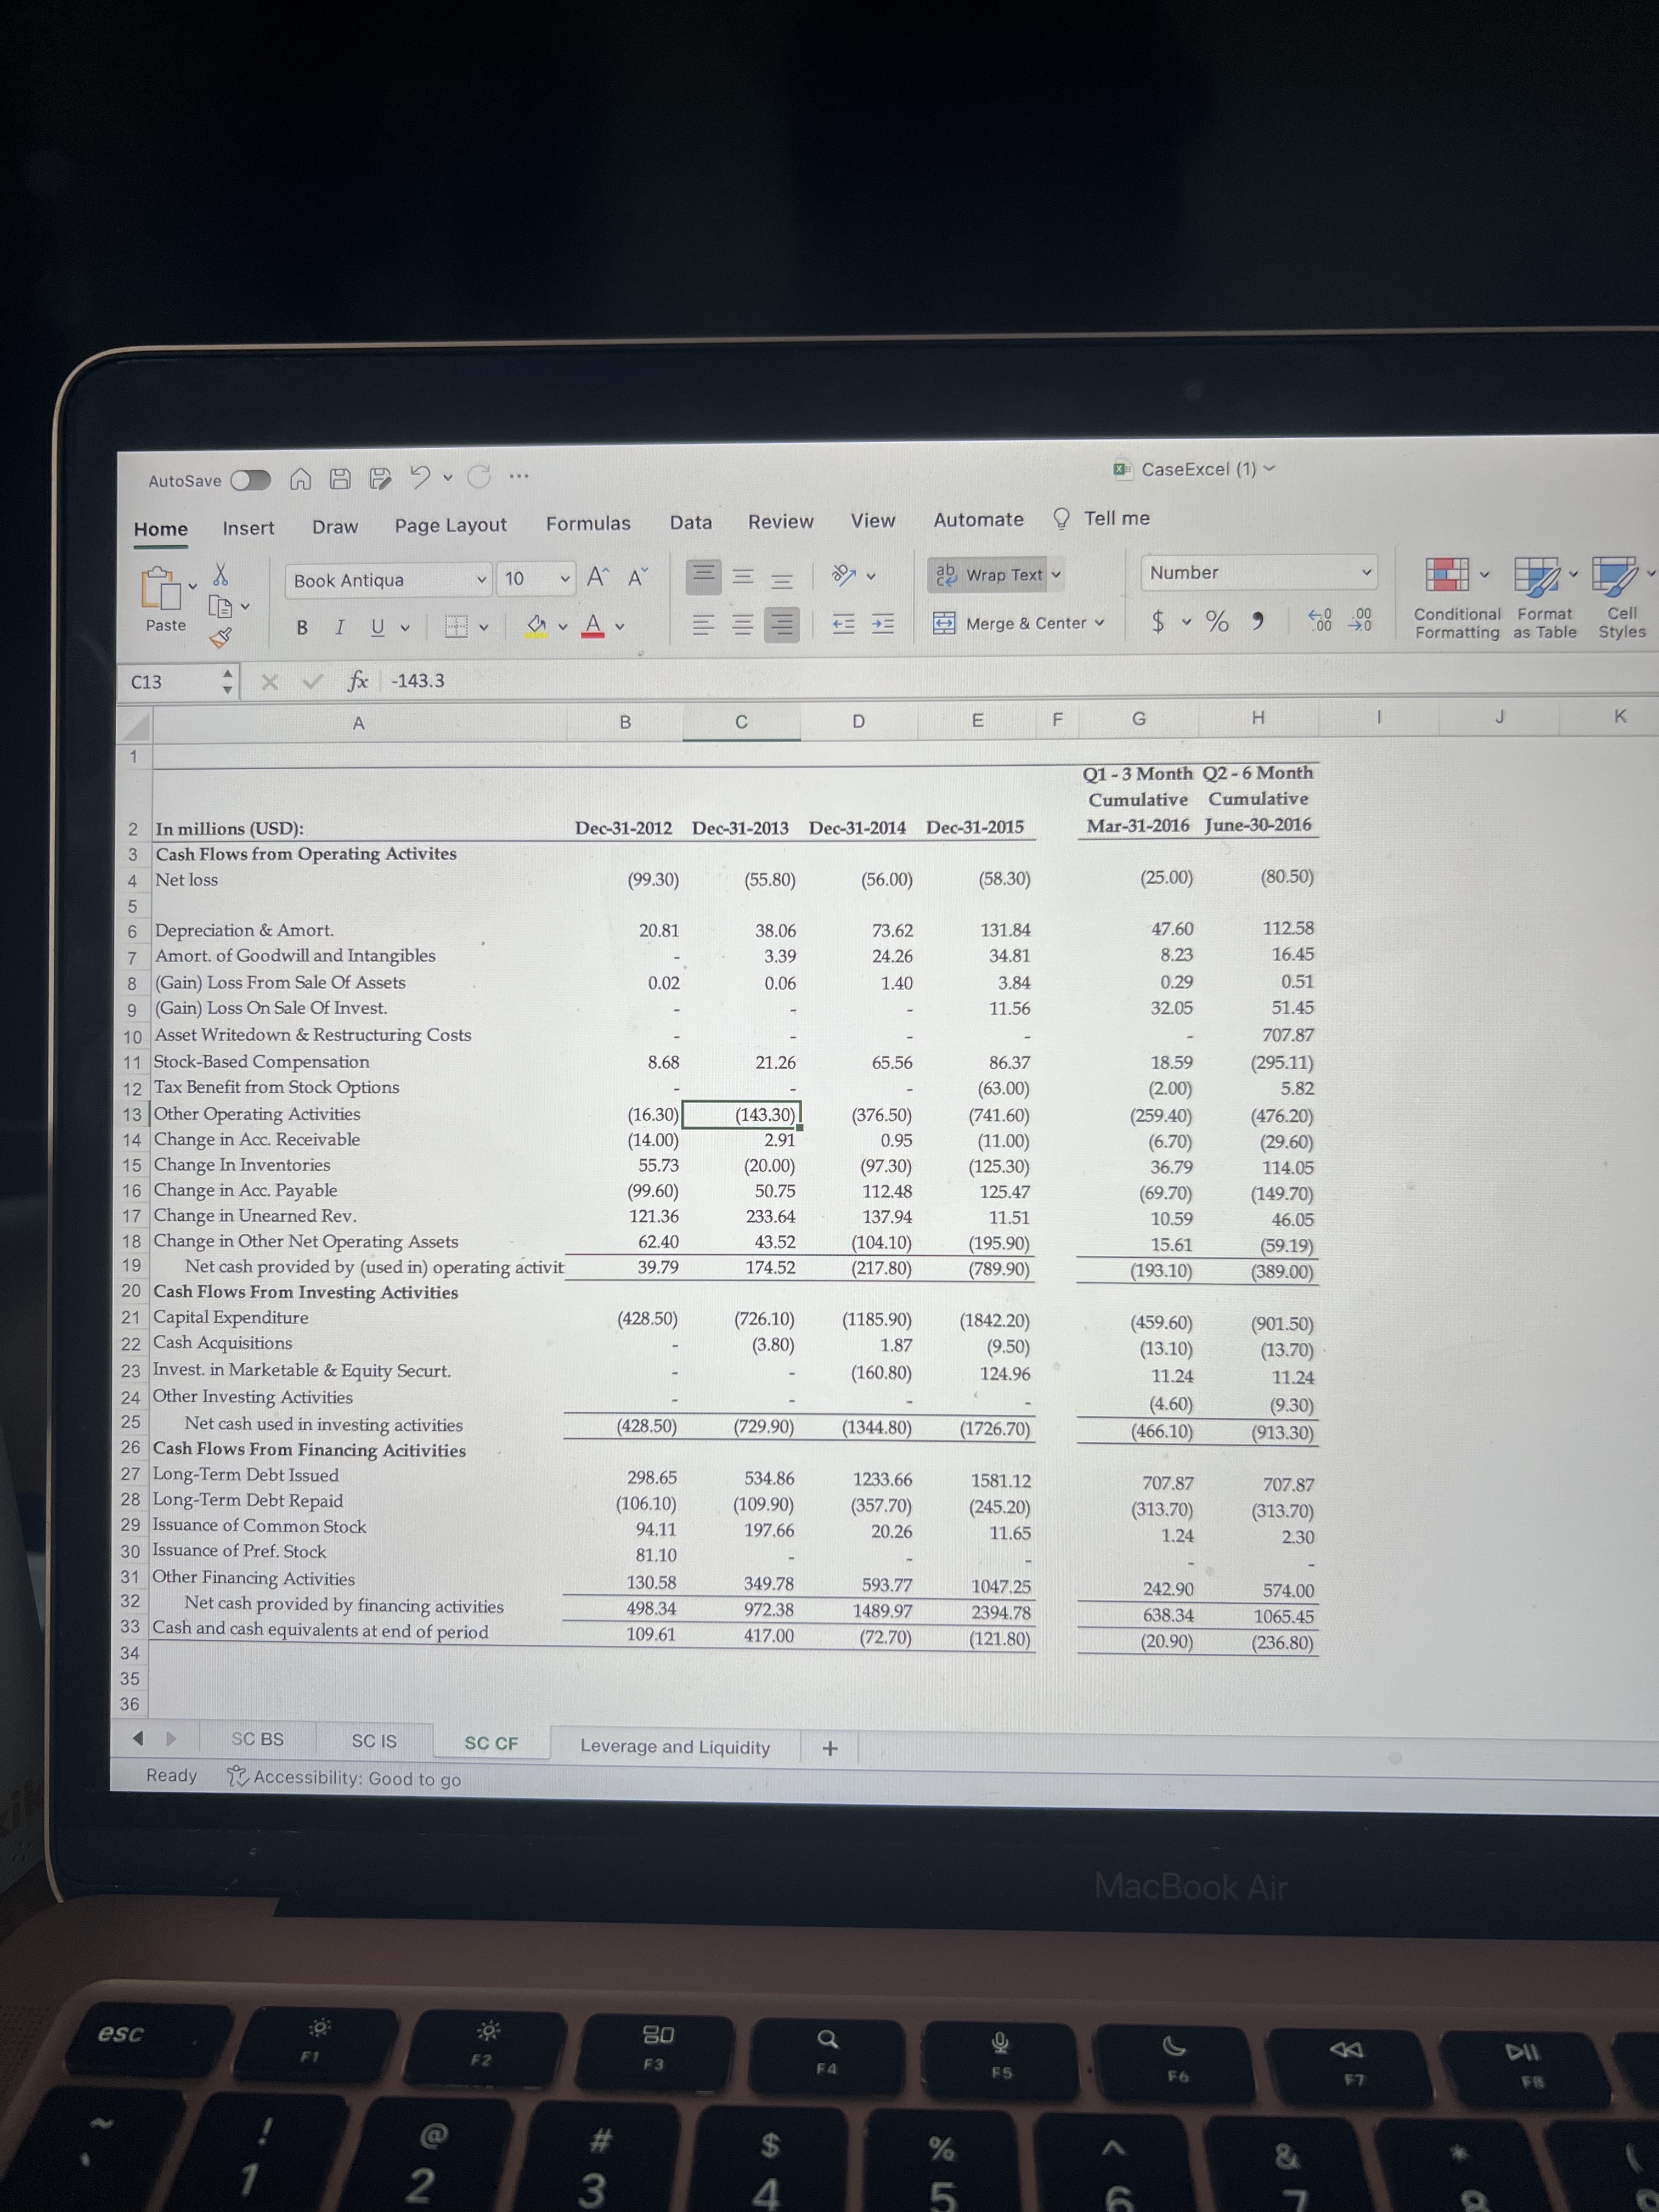
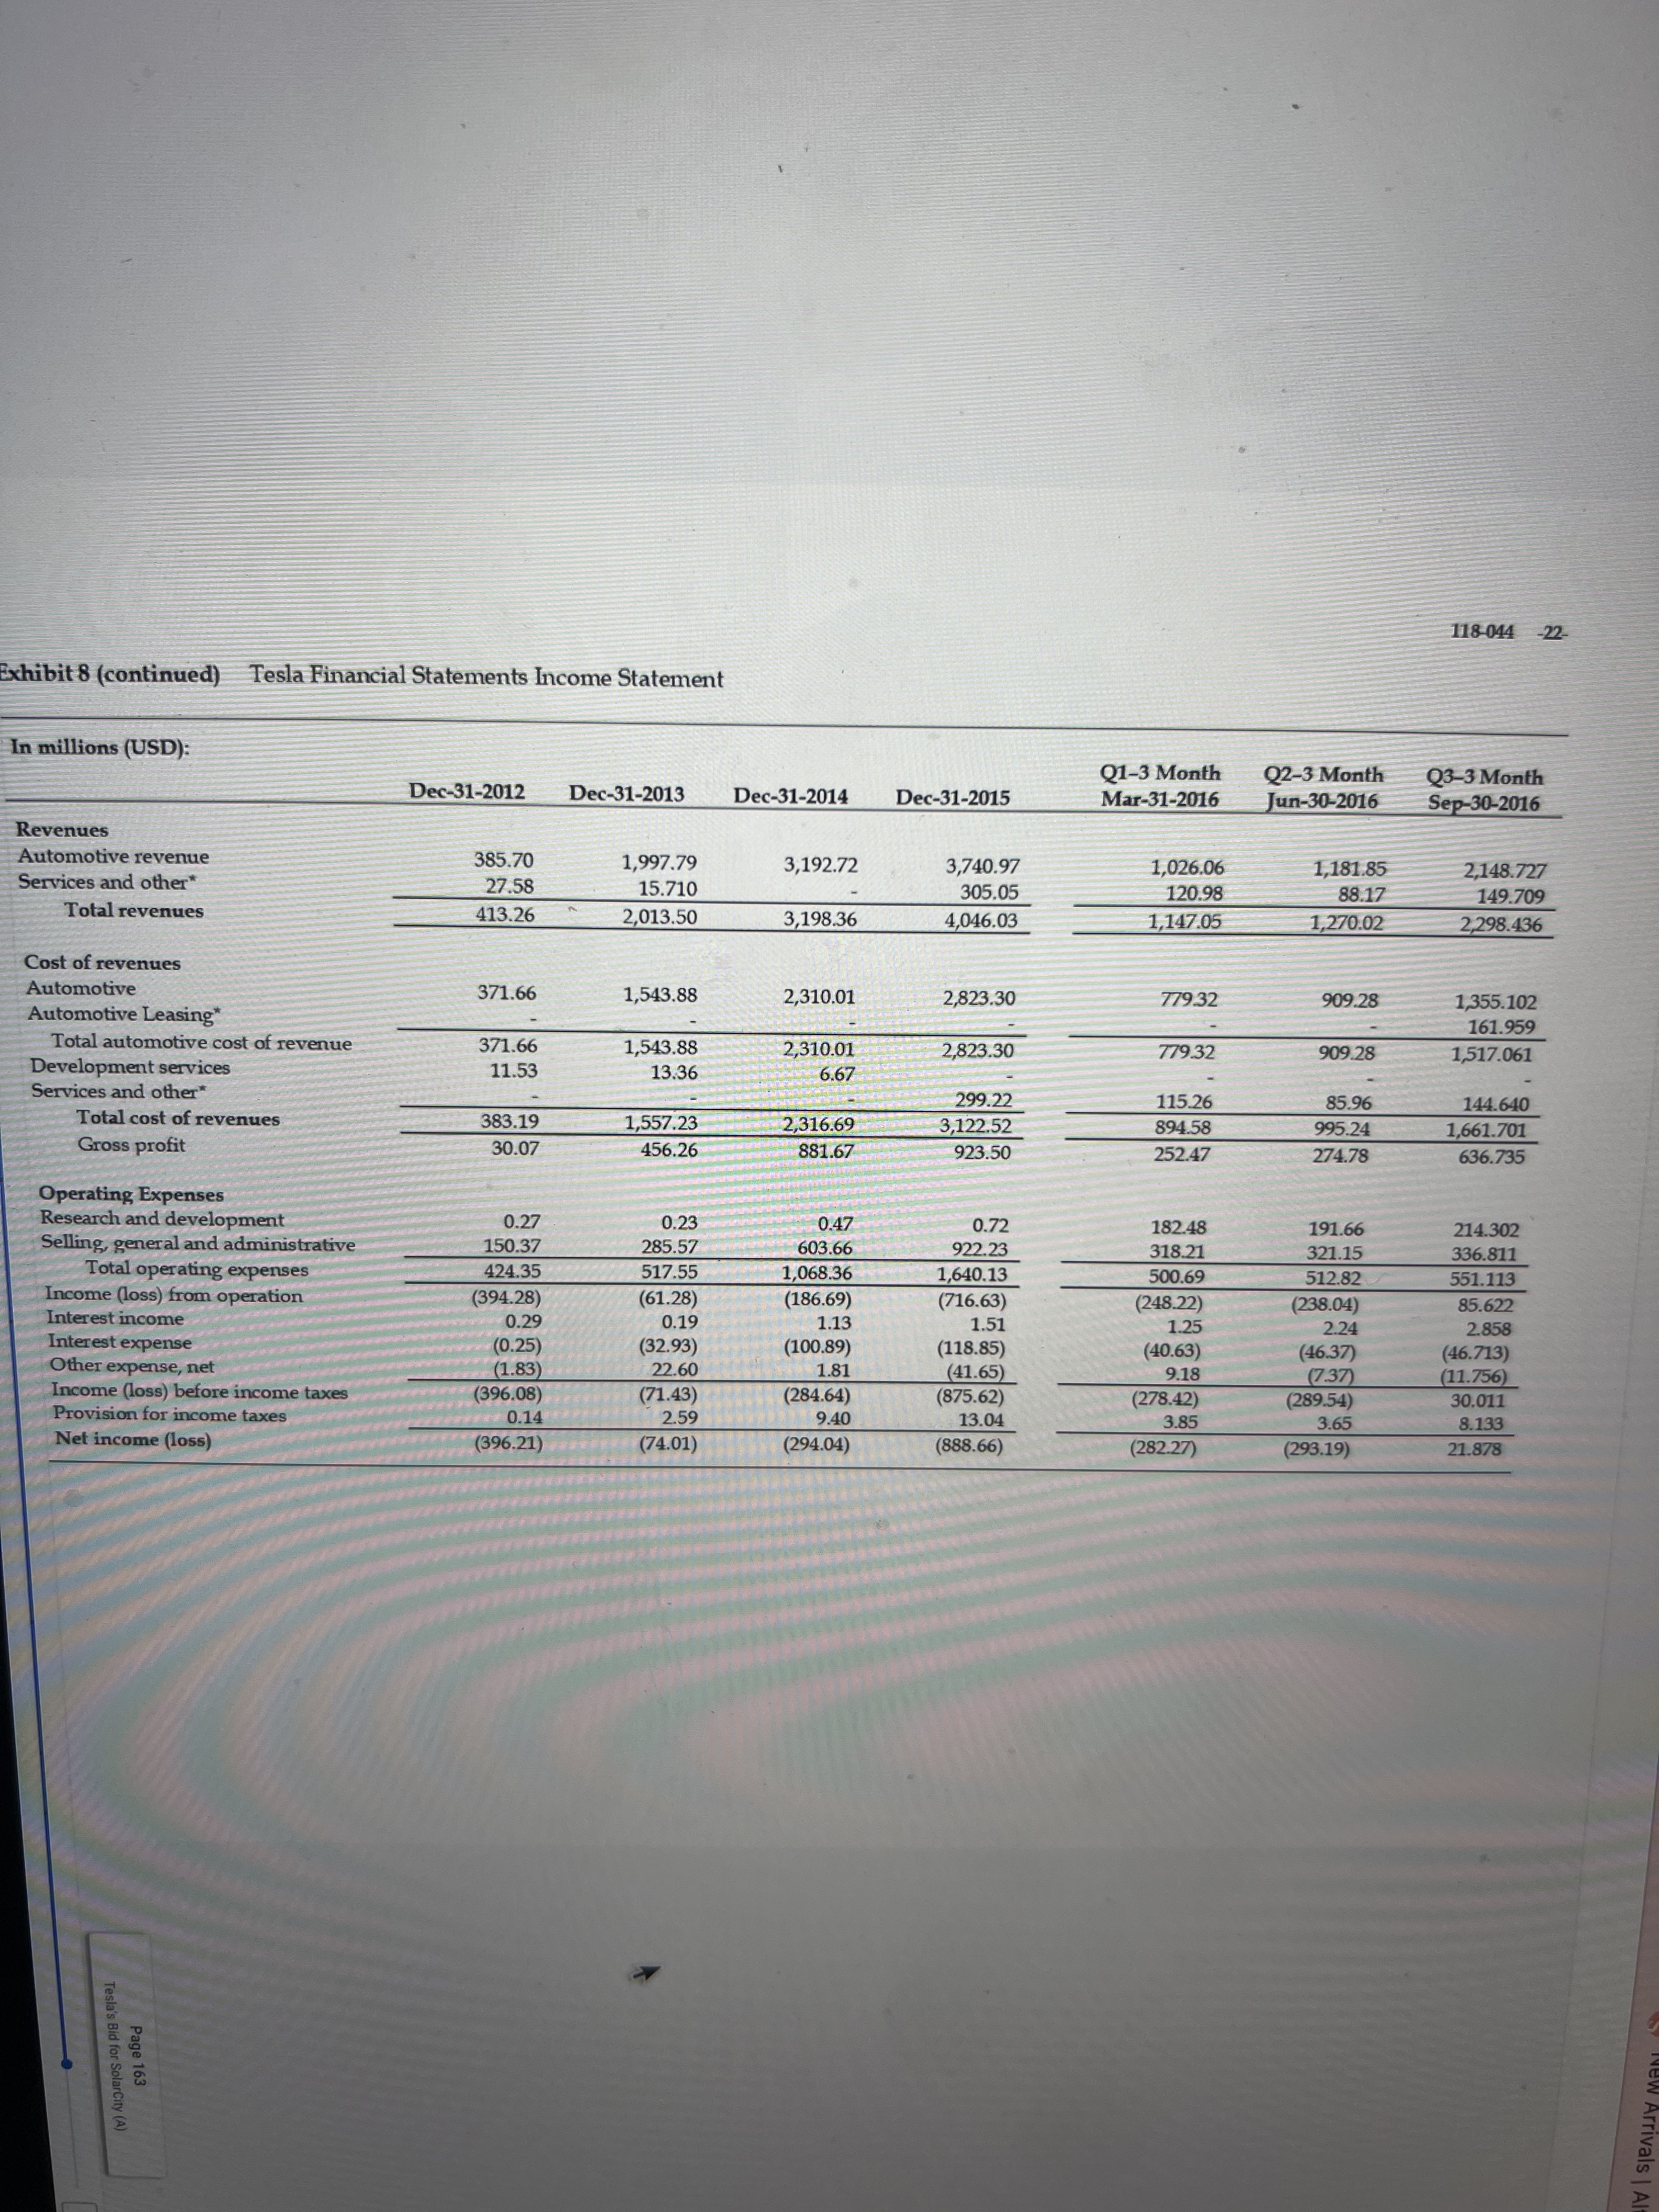
118 044 -22 Exhibit 8 (continued) Tesla Financial Statements Income Statement In millions (USD): Q1-3 Month Q2-3 Month Q3-3 Month Dec-31-2012 Dec-31-2013 Dec-31-2014 Dec-31-2015 Mar-31-2016 Jun-30-2016 Sep-30-2016 Revenues Automotive revenue 385.70 1,997.79 3,192.72 3,740.97 1,026.06 1,181.85 2,148.727 Services and other* 27.58 15.710 305.05 120.98 88.17 149.709 Total revenues 413.26 2,013.50 3,198.36 4,046.03 1,147.05 1,270.02 2,298.436 Cost of revenues Automotive 371.66 1,543.88 2,310.01 2,823.30 779.32 909.28 1,355.102 Automotive Leasing" 161.959 Total automotive cost of revenue 371.66 1,543.88 2,310.01 2,823.30 779.32 909.28 1,517.061 Development services 11.5 13.36 6.67 Services and other* 299.22 115.26 85.96 144.640 Total cost of revenues 383.19 ,557.23 2,316.69 3,122.52 894.58 995.24 ,661.701 Gross profit 30.07 456.26 881.67 923.50 252.47 274.78 636.735 Operating Expenses Research and development 0.27 0.23 0.47 0.72 182.48 191.66 214.302 Selling, general and administrative 150.37 285.57 603.66 922.23 318.21 321.15 336.811 Total operating expenses 424.35 517.55 1,068.36 ,640.13 500.69 512.82 551.113 Income (loss) from operation (394.28) (61.28) (186.69) 716.63) 248.22) 238.04) 85.622 Interest income 0.29 0.19 1.13 1.51 1.25 2.24 2.858 Interest expense (0.25) 32.93) (100.89) 118.85) (40.63) (46.37) 46.713) Other expense, net (1.83) 22.60 1.81 (41.65) 9.18 (7.37) (11.756) Income (loss) before income taxes (396.08) (71.43) 284.64) 875.62) (278.42) 289.54) 30.011 Provision for income taxes 0.14 2.59 9.40 13.04 3.85 3.65 8.133 Net income (loss) (396.21) 74.01) (294.04) (888.66) 282.27) (293.19) 21.878 Tesla's Bid for SolarCity (A) Page 163Auto Save On A B b . C ... *= CaseExcel (1) Home Insert Draw Page Layout Formulas Data Review View Automate ? Tell me Book Antiqua 10 " A A ag Wrap Text v General Paste B U Merge & Center v $ ~ % " R23 A B CD E F G H Q1 - 3 Month Q2 - 3 Month 2 In millions (USD) Dec-31-2012 Dec-31-2013 Dec-31-2014 Dec-31-2015 Mar-31-2016 June-30-2016 3 Assets 4 Current assets Cash And Equivalents 160.08 577.08 504.38 382.54 361.66 145.71 Inventory 87.09 111.39 217.22 342.95 306.69 229.70 Prepaid Exp. 11.40 26.92 50.22 77.63 64.24 56.95 Short Term Investments 138.31 Recievables 42.23 43.24 53.03 45.74 52.16 79.4 10 Deferred Tax Assets, Curr. 5.62 9.85 13.15 11 Restricted Cash 7.52 19.18 20.88 39.86 51.61 9.48 12 Other Current Assets 0.42 2.10 13 Total Current Assets 313.94 787.66 997.62 902.14 836.35 611.31 14 Property, Plant & Equipment (net) 18.64 22.41 101.91 546.89 789.91 909.29 15 Goodwill 0.63 148.88 315.92 321.87 321.87 321.87 16 Other Intangibles 129.29 223.64 195.24 187.02 163.41 17 Accounts Receivable Long-Term 34.54 488.46 539.43 529.85 18 Deferred Charges, LT 13.15 215.71 238.41 237.46 19 Other Long-Term Assets 1,009.10 1,721.30 2,864.44 4,616.82 5,046.22 5,450.90 20 Total Assets 1,342.30 2,809.53 4,551.22 7,287.12 7,959.21 8,224.08 21 Liabilities and Stockholders' Equity 22 Accounts payable 62.99 121.56 237.81 364.97 294.18 214.15 23 Accrued expenses 43.97 50.84 95.15 143.94 174.62 154.76 24 Current portion of LT debt & Cap. le 36.60 41.59 59.05 414.91 502.18 520.87 25 Curr. Income Taxes Payable 1.58 41.02 23.94 26 Unearned Revenue, Current 46.47 78.48 104.81 118.41 132.03 135.42 27 Other Current Liabilities 23.96 44.16 69.70 110.11 108.34 51.82 28 Total Current Liabilities 213.98 338.21 566.51 1,193.36 1,211.35 1,100.95 29 30 Long-Term Debt and Capital Leases 252.86 624.02 1,457.56 2,452.56 2,750.37 2,879.03 31 Unearned Revenue, Non-Current 552.47 880.66 1,009.68 1,453.18 1,490.56 1,515.77 32 Def. Tax Liability, Non-Curr. 5.64 9.24 13.19 1.37 0.79 0.07 33 Other Non-Current Liabilities 24.13 108.28 161.89 452.09 784.07 856.89 34 Total Liabilities 1,049.08 1,960.41 3,208.85 5,552.56 6,237.13 6,352.71 35 36 Additional Paid In Capital 330.13 819.91 1,003.99 1,195.25 1,227.55 1,287.96 37 Retained Earnings (146.50) (202.30) (258.40) (316.70) (341.70) (397.20) 38 Minority Interest 109.62 231.53 596.73 856.00 836.19 980.57 39 Total Equity 293.22 849.12 1,342.37 1,734.56 1,722.07 1,871.38 40 Total Liabilities And Equity 1,342.30 2,809.53 4,551.22 7,287.12 7,959.21 8,224.08 41 42 SC BS SC IS SC CF Leverage and Liquidity + Ready 12 Accessibility: Good to go MacBook AirAutoSave O N A D V . C ... CaseExcel (1) ~ Home Insert Draw Page Layout Formulas Data Review View Automate Tell me Book Antiqua 10 AA 097 V ab, Wrap Text Number Paste B I U V F Y Av Merge & Center v $ ~ % " 00 80 Conditional Format Cell Formatting as Table Styles D26 + XV fx - 56 A B C D E F G H Q1 -3 Month Q2-3 Month In millions (USD): Dec-31-2012 Dec-31-2013 Dec-31-2014 Dec-31-2015 Mar-31-2016 June-30-2016 Revenue 3 Operating Leases and Solar Energy Systems Incentives 46.10 82.86 173.64 293.54 100.55 160.11 4 Solar Energy Systems and Components Sales 80.81 86'08 81.40 106.08 22.02 25.67 5 Total Revenue 126.91 163.84 255.03 399.62 122.57 185.78 6 Cost of Revenues 7 Operating Leases and Solar Energy Systems Incentives 14.60 32.75 92.92 165.55 33.48 38.10 8 Solar Energy Systems and Components Sales 84.86 91.72 83.51 115.25 27.63 32.19 9 Total Cost of Revenues 99.45 124.47 176.43 280.79 61.11 70.29 10 Gross Profit 27.46 39.37 78.60 118.83 51.46 115.49 Operating Expenses 12 Selling General & Admin Exp 118.47 185.83 394.73 701.69 213.01 202.74 13 R & D Exp. 1.52 19.16 64.93 13.92 4.37 14 Depreciation & Amort. 48.04 $3.40 15 Total operating expenses 118.47 187.35 413.90 766.62 274.96 280.52 16 Income (loss) from operation 91.00) 148.00) 335.30) (647.80) (213.50) (165.00) 17 Interest Expense (28.20 (25.70) 55.80) (103.50) (64.50) (56.20) 18 Interest and Invest. Income 8.10 19 Other expense,net (2.50) (1.10) (10.60) (8.40) (5.10) 0.02 20 Restructuring Charges (29.10) Asset Writedown (1.40) (0.30) (29.10) Other Unusual Items 0.30) 5.80 23 Income Tax Expense 0.05 (24.80 (26.70 3.33 (0.10) 0.01 24 Net Income to Company (113.70) (151.80) 375.20) 768.80) (283.10) 250.30) 25 Minority Int. in Earnings 14.39 5.97 319.20 710.49 258.12 194.77 26 Net Income (loss) 99.30) (55.80) (56.00) (58.30) (25.00) (55.50) SC BS SC IS SC CF Leverage and Liquidity + Ready Accessibility: Good to go MacBook Air 80 a DIL F5AutoSave On A $ 5 . C ... CaseExcel (1) ~ Draw Page Layout Formulas Data Review View Automate ? Tell me Home Insert Book Antiqua 10 A A 27 v ab Wrap Text v Number Paste B I U V V QV A v Merge & Center v $ ~ % " Conditional Format Cell Formatting as Table Styles C13 X V fx - 143.3 B C D E F G H K 1 Q1 - 3 Month Q2 - 6 Month Cumulative Cumulative 2 In millions (USD): Dec-31-2012 Dec-31-2013 Dec-31-2014 Dec-31-2015 Mar-31-2016 June-30-2016 3 Cash Flows from Operating Activites 4 Net loss (99.30) (55.80) (56.00) (58.30) (25.00) (80.50) 5 20.81 38.06 73.62 131.84 47.60 112.58 6 Depreciation & Amort. 7 Amort. of Goodwill and Intangibles 3.39 24.26 34.81 8.23 16.45 8 (Gain) Loss From Sale Of Assets 0.02 0.06 1.40 3.84 0.29 0.51 9 (Gain) Loss On Sale Of Invest. 11.56 32.05 51.45 10 Asset Writedown & Restructuring Costs 707.87 11 Stock-Based Compensation 3 68 1.26 5 56 86.37 18.59 (295.11) 12 Tax Benefit from Stock Options (63.00) (2.00) 5.82 13 Other Operating Activities (16.30) 143.30) 376.50) (741.60) 259.40) (476.20) 14 Change in Acc. Receivable (14.00) 2.91 0.9 (11.00) (6.70) (29.60) 15 Change In Inventories 55.73 (20.00) 97.30) 125.30 36.79 114.05 16 Change in Acc. Payable (99.60) 50.75 112.48 125.47 69.70) 149.70) 17 Change in Unearned Rev. 121.36 233.64 137.94 11.51 10.59 46.05 18 Change in Other Net Operating Assets 62.40 43.52 (104.10) 195.90) 15.61 (59.19) 19 Net cash provided by (used in) operating activit 39.79 174.52 (217.80) (789.90) (193.10) (389.00) 20 Cash Flows From Investing Activities 21 Capital Expenditure (428.50) (726.10) (1185.90) (1842.20) (459.60) (901.50) 22 Cash Acquisitions (3.80) 1.8 (9.50) 13.10) (13.70) 23 Invest. in Marketable & Equity Securt. 160.80) 124.96 11.24 11.24 24 Other Investing Activities (4.60) (9.30) 25 Net cash used in investing activities 428.50) (729.90) (1344.80) (1726.70) (466.10) 913.30) 26 Cash Flows From Financing Acitivities 27 Long-Term Debt Issued 298.65 534.86 1233.66 1581.12 707.87 707.87 28 Long-Term Debt Repaid (106.10) (109.90) 357.70 (245.20) 313.70) 313.70) 29 Issuance of Common Stock 94.11 197.66 20.26 11.65 1.24 2.30 30 Issuance of Pref. Stock 81.10 31 Other Financing Activities 130.58 349.78 593.77 1047.25 242.90 574.00 32 Net cash provided by financing activities 498.34 972.38 1489.97 2394.78 638.34 1065.45 33 Cash and cash equivalents at end of period 109.61 417.00 (72.70) (121.80) 20.90) (236.80) 34 35 36 4 SC BS SC IS SC CF Leverage and Liquidity + Ready 1 Accessibility: Good to go MacBook Air esc 80 F2 G DIL F3 FA E6 @AutoSave On A P J . C ... CaseExcel (1) ~ Home Insert Draw Page Layout Formulas Data Review View Automate Tell me Book Antiqua 10 ~ A A ce Wrap Text v General Insert v Ex AY EX Delete v Paste B I U ~ | ~ GAV Merge & Center $ ~ % " 00 -20 Conditional Format Cell DV Sort Formatting as Table Format 23 + X V fx A B C D E F G H 2012 2013 2014 2015 Current Ratio Tesla SolarCity Tesla + SolarCity Quick Ratio Tesla SolarCity Tesla + SolarCity EBITDA Interest Coverage Tesla SolarCity Tesla + SolarCity Cash Flow from Operations to Debt Tesla SolarCity Tesla + SolarCity Leverage (A/ E) Tesla SolarCity Tesla + SolarCity Debt-to-Equity Tesla SolarCity Tesla + SolarCity SC BS SC IS SC CF Leverage and Liquidity + Ready Accessibility: Good to go MacBook Air a G 44 DII A F3 EA ES F6 $7 FB
Step by Step Solution
There are 3 Steps involved in it
Step: 1
Get Instant Access to Expert-Tailored Solutions
See step-by-step solutions with expert insights and AI powered tools for academic success
Step: 2
Step: 3
Ace Your Homework with AI
Get the answers you need in no time with our AI-driven, step-by-step assistance