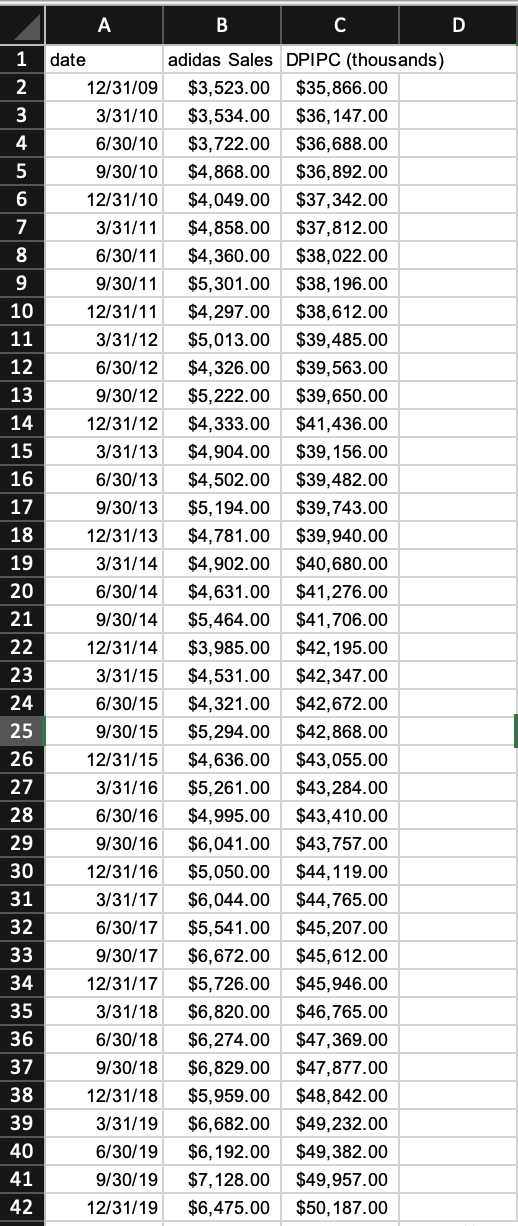
Using forecast X please solve questions with the provided data sets.

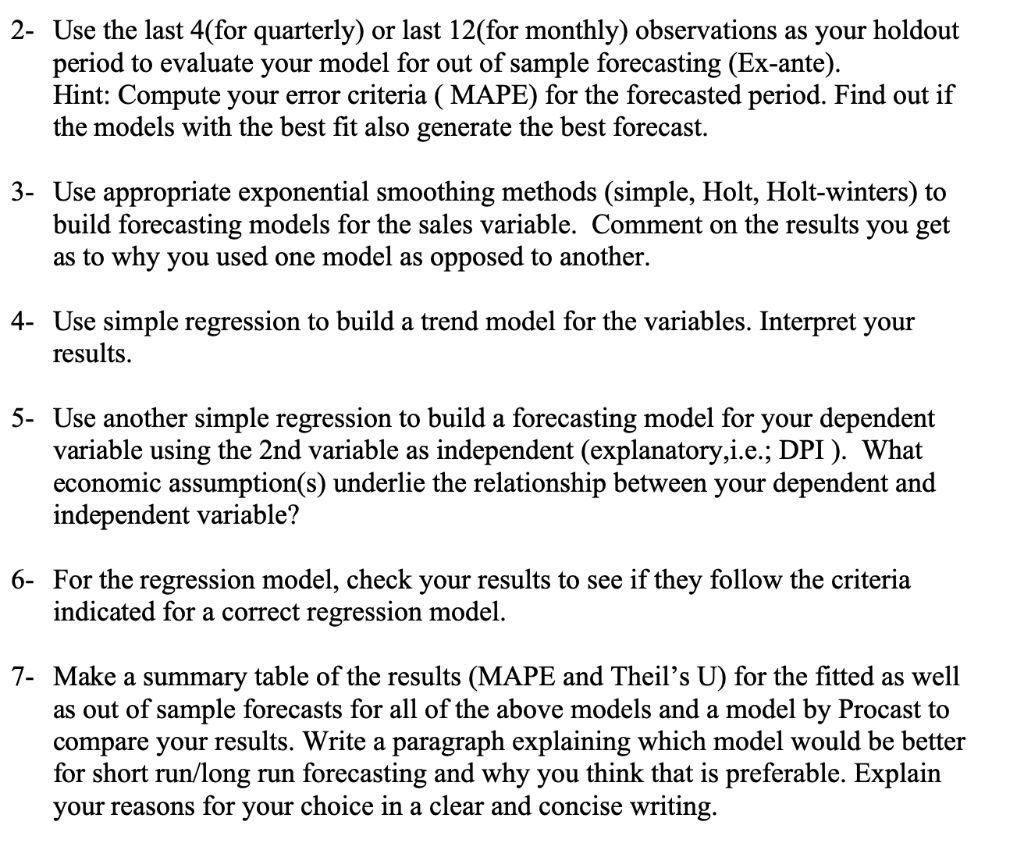
2- Use the last 4(for quarterly) or last 12 (for monthly) observations as your holdout period to evaluate your model for out of sample forecasting (Ex-ante). Hint: Compute your error criteria (MAPE) for the forecasted period. Find out if the models with the best fit also generate the best forecast. 3- Use appropriate exponential smoothing methods (simple, Holt, Holt-winters) to build forecasting models for the sales variable. Comment on the results you get as to why you used one model as opposed to another. 4- Use simple regression to build a trend model for the variables. Interpret your results. 5- Use another simple regression to build a forecasting model for your dependent variable using the 2 nd variable as independent (explanatory,i.e.; DPI ). What economic assumption(s) underlie the relationship between your dependent and independent variable? 6- For the regression model, check your results to see if they follow the criteria indicated for a correct regression model. 7- Make a summary table of the results (MAPE and Theil's U) for the fitted as well as out of sample forecasts for all of the above models and a model by Procast to compare your results. Write a paragraph explaining which model would be better for short run/long run forecasting and why you think that is preferable. Explain your reasons for your choice in a clear and concise writing. 2- Use the last 4(for quarterly) or last 12 (for monthly) observations as your holdout period to evaluate your model for out of sample forecasting (Ex-ante). Hint: Compute your error criteria (MAPE) for the forecasted period. Find out if the models with the best fit also generate the best forecast. 3- Use appropriate exponential smoothing methods (simple, Holt, Holt-winters) to build forecasting models for the sales variable. Comment on the results you get as to why you used one model as opposed to another. 4- Use simple regression to build a trend model for the variables. Interpret your results. 5- Use another simple regression to build a forecasting model for your dependent variable using the 2 nd variable as independent (explanatory,i.e.; DPI ). What economic assumption(s) underlie the relationship between your dependent and independent variable? 6- For the regression model, check your results to see if they follow the criteria indicated for a correct regression model. 7- Make a summary table of the results (MAPE and Theil's U) for the fitted as well as out of sample forecasts for all of the above models and a model by Procast to compare your results. Write a paragraph explaining which model would be better for short run/long run forecasting and why you think that is preferable. Explain your reasons for your choice in a clear and concise writing


