

Question
Using Graphical Data to Interpret Operating Lease Footnotes The following graphics relate to operating leases for S&P 500 firms from 2010 through 2018. The data
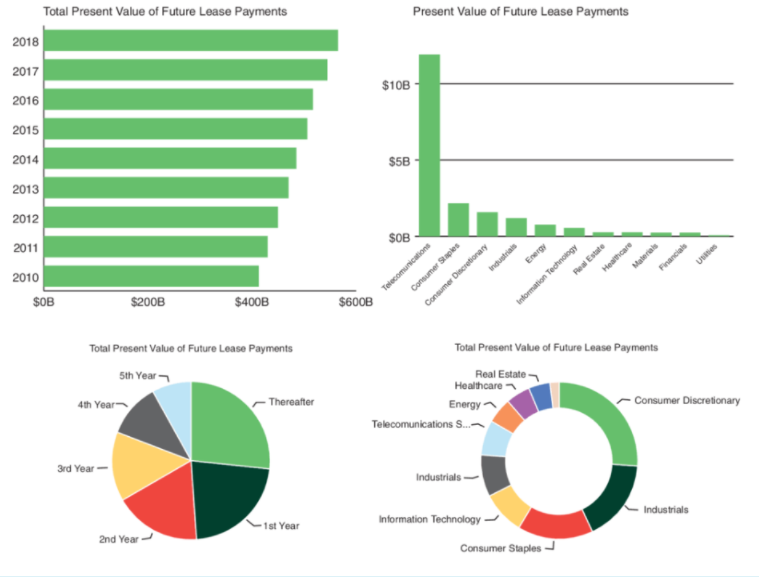
Using Graphical Data to Interpret Operating Lease Footnotes The following graphics relate to operating leases for S&P 500 firms from 2010 through 2018. The data come from the period before the new lease standards because most firms adopted the standard in fiscal 2019 (the first mandated year). Present values are calculated with a 5% discount rate.
Click the following link to access the Power BI dashboard to answer the requirements:
https://app.powerbi.com/view?r=eyJrIjoiNjI5NDdhNWYtYmVhYy00M2Q2LTliMGUtZTQ2ZWYwYjA1NTA2IiwidCI6IjY1YzViOWIzLWYxNWYtNDkwZS1iNGY0LThjOGM1OTRhM2Q5NSJ9
Required a. Consider the top left panel. 1. What pattern do we observe for the overall level of operating leases overtime? Answer Choices:
The present value of operating leases as increased each year prior to the new lease standard.
The present value of operating leases as decreased each year prior to the new lease standard.
The present value of operating leases as increased each year after the new lease standard.
The present value of operating leases as decreased each year after the new lease standard. 2. How does this affect our analysis of a companys leverage? Answer Choices"
Increases transparency
Decreases transparency
Doesn't impact transparency b. Consider the bottom right panel. Which industrial sector has the most operating leases? Answer Choices:
Consumer discretionary
Consumer staples
Energy
Financials
Healthcare
Industrials
Information technology
Materials
Real estate
Telecommunications
Utilities c. Consider the top right panel. Which industrial sector has the largest average operating leases? Answer Choices:
Consumer discretionary
Consumer staples
Energy
Financials
Healthcare
Industrials
Information technology
Materials
Real estate
Telecommunications
Utilities d. Consider the pie chart that shows lease payments by year (bottom left panel). Which sector has the longest lease terms? Answer Choices:
Consumer discretionary
Consumer staples
Energy
Financials
Healthcare
Industrials
Information technology
Materials
Real estate
Telecommunications
Utilities
Total Present Value of Future Lease Payments Present Value of Future Lease Payments 2018 2017 2016 $10B 2015 2014 $5B 2013 2012 SOB 2011 Energy Financial Us 2010 $OB Consumer Staples Telecomunication $200B $400B $600B Consumer Discretionary Industriais Information Technology Real Estate Healthcare Total Present Value of Future Lease Payments 5th Year 4th Year Thereafter Total Present Value of Future Lease Payments Real Estate Healthcare Energy Consumer Discretionary Telecomunications ... 3rd Year - Industrials Industrials - 1st Year 2nd Year Information Technology Consumer StaplesStep by Step Solution
There are 3 Steps involved in it
Step: 1

Get Instant Access to Expert-Tailored Solutions
See step-by-step solutions with expert insights and AI powered tools for academic success
Step: 2

Step: 3
Ace Your Homework with AI
Get the answers you need in no time with our AI-driven, step-by-step assistance
Get Started
Frank Woods Business Accounting
Authors: Frank Wood, Alan Sangster
9th Edition
0273655523, 9780273655527