Using IR graph below, H'NMR data below, and C'NMR data. Determine the Structure ! and why you came to that conclusion !
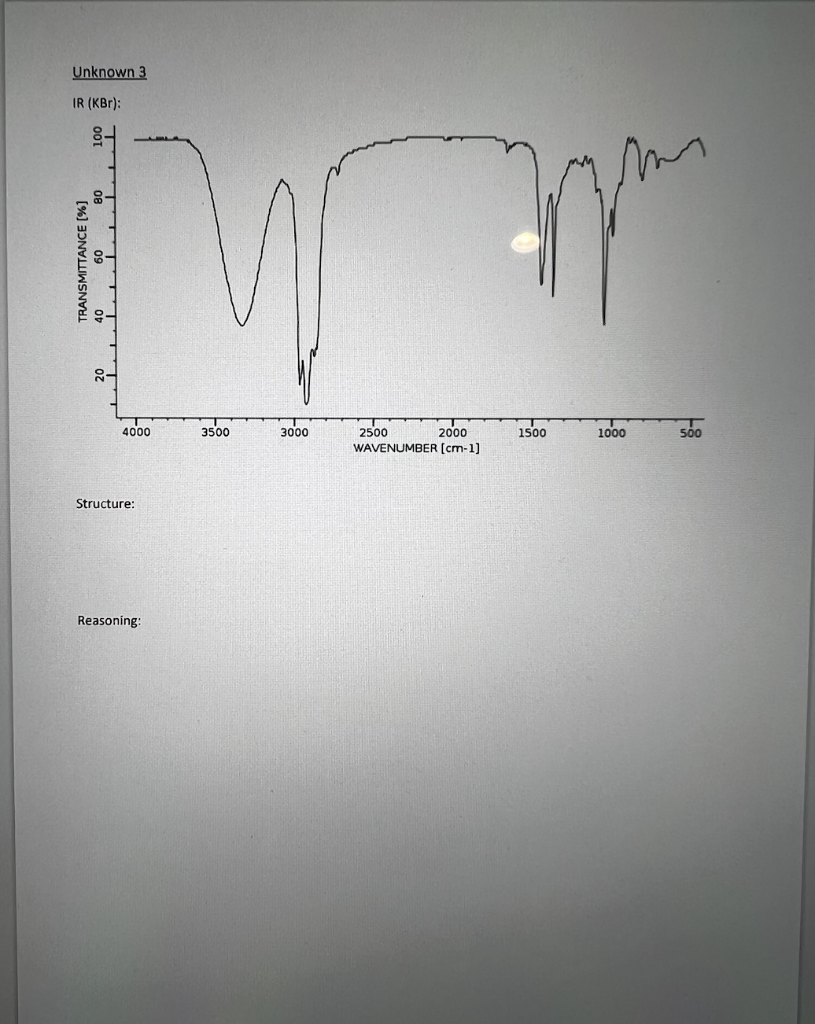
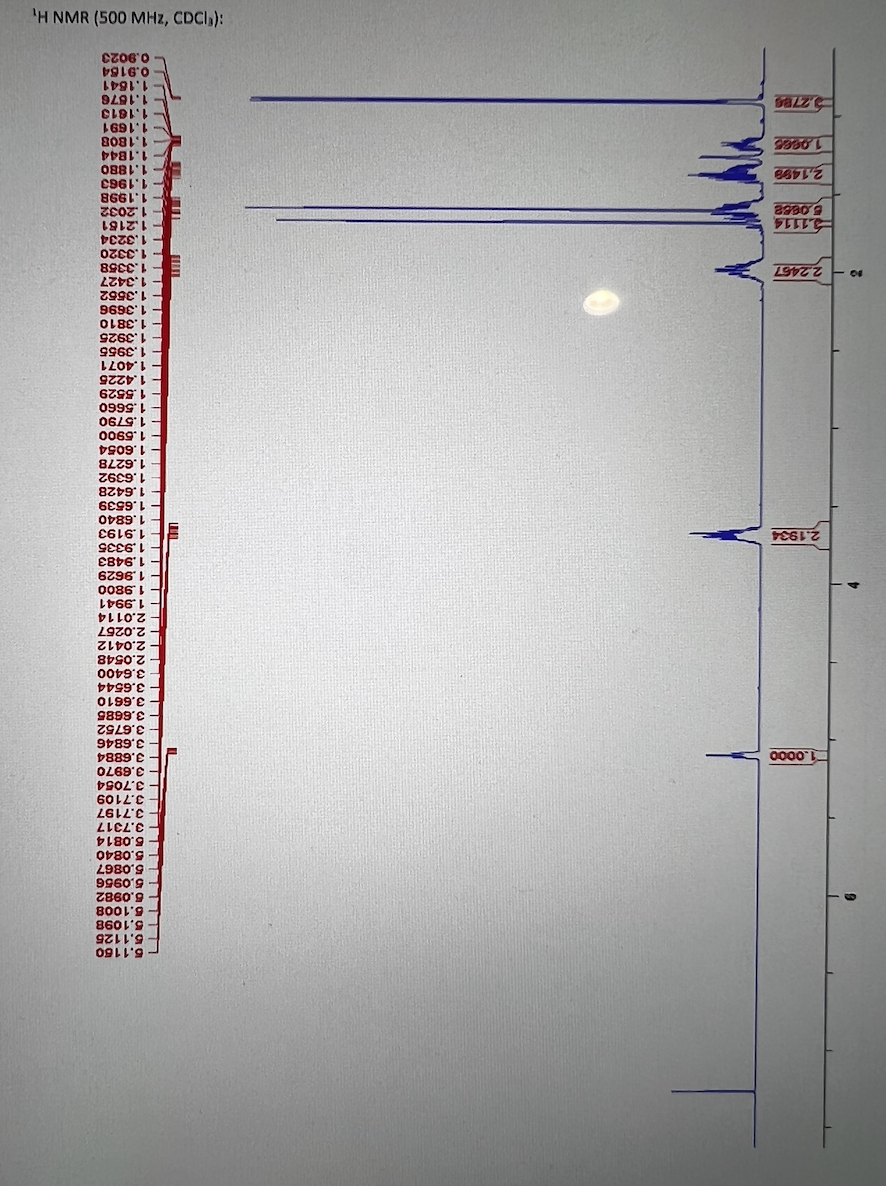
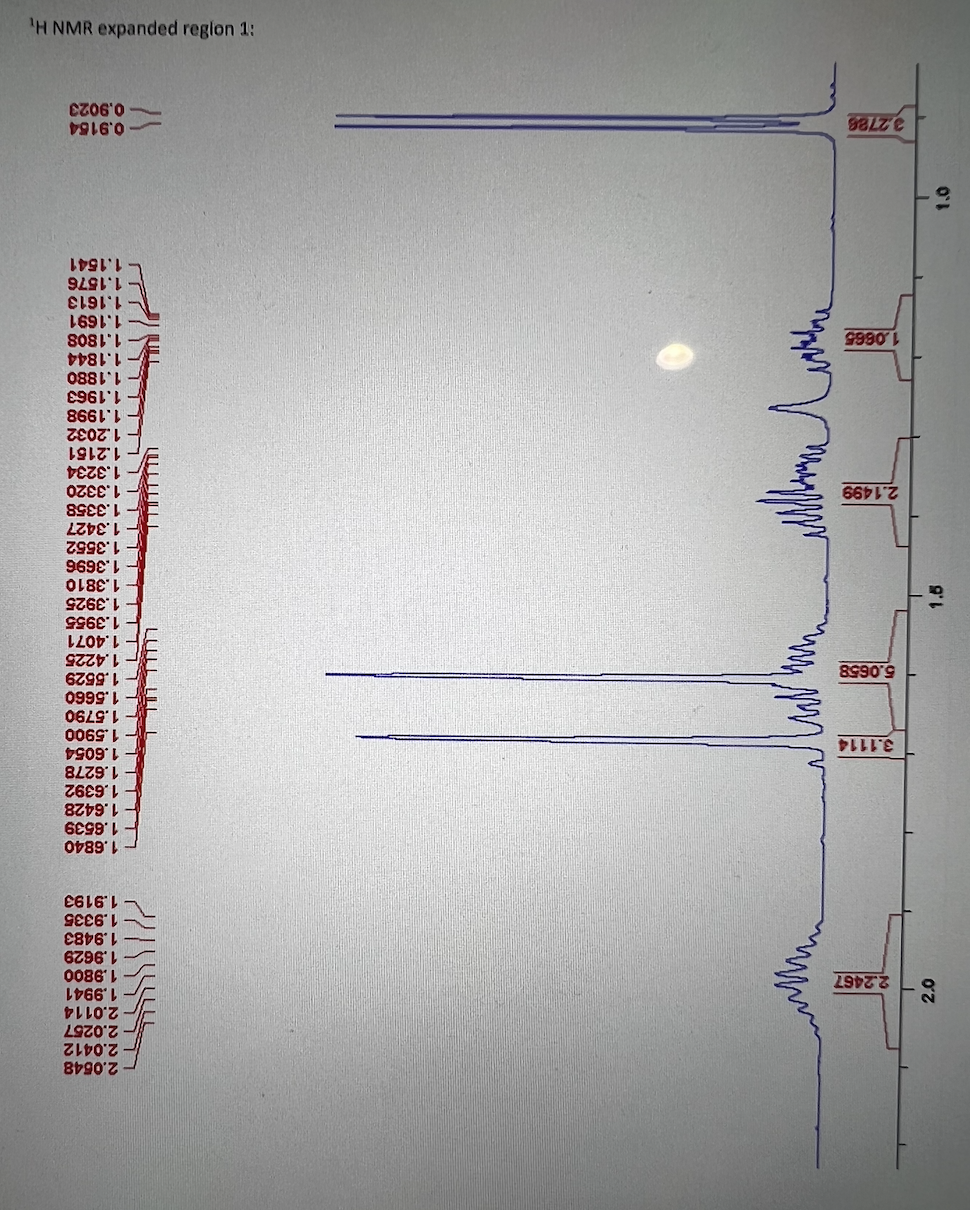
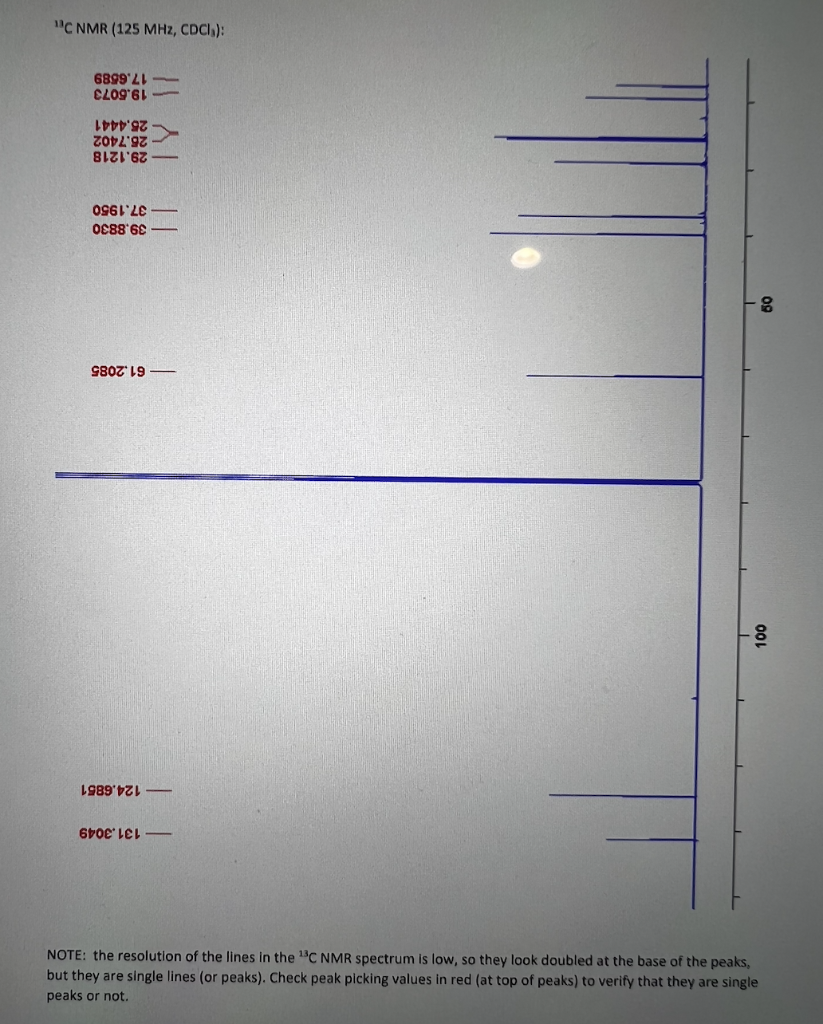
Unknown 3 IR (KB): - TRANSMITTANCE [%] de 09 - 4000 3500 3000 1500 1000 500 2500 2000 WAVENUMBER (cm-1) Structure: Reasoning 1.0000 2.1934 6.1 160 6.1125 5.1098 6.1008 5.0982 6,0956 5.0867 5.0840 6.0814 3.7317 3.7197 3.7109 3.7054 3.6970 3.6884 3.6846 3.6752 3.6685 3.6610 3.6544 3.6400 2.0548 2.0412 2.0267 2.0114 1.9941 1.9800 1.9629 1.9483 1.9335 1.9193 1.6840 1.6539 1.6428 1.6392 1.6278 1.6054 1.5900 1.5790 1.5660 1.5529 1.4225 1.4071 1.3955 1.3925 - 1.3810 - 1.3696 -1.3562 - 1.3427 1.3358 - 1.3320 - 1.3234 - 1.2181 1.2032 1.1998 1.1963 1.1880 1.1844 1.1808 1.1691 - 1.1813 - 1.1876 1.1641 - 0.9164 0.9023 102.2467 5 0882 2.1498 1.0985 27es (PIDAD 'ZHW 00S) WNH, 2.0 2.2467 TSS| 2.0548 - 2.0412 2.0257 2.0114 1.9941 1.9800 1.9629 1.9483 1.9335 1.9193 3.1114 : 5.0658 1.6 1.6840 1.6539 1.6428 1.6392 1.6278 1.6054 1.5900 1.5790 = 1.5660 1.5529 1.4225 1.4071 -1.3955 1.3925 1.3810 1.3696 1.3552 1.3427 1.3358 1.3320 1.3234 1.2151 1.2032 1.1998 1.1963 1.1880 1.1844 1.1808 1.1691 1.1613 1.1576 1.1541 2.1499 LLLLLLLLL UL 1,0665 215 0.9164 0.9023 [ u0|80i popupdx AWN H C NMR (125 MHz, CDCI): 17.6589 19.5073 28.4441 28.7402 29.1218 IY 37.1950 39.8830 61.2085 - 100 124.6851 131.3049 NOTE: the resolution of the lines in the "SC NMR spectrum is low, so they look doubled at the base of the peaks, but they are single lines (or peaks). Check peak picking values in red (at top of peaks) to verify that they are single peaks or not. Unknown 3 IR (KB): - TRANSMITTANCE [%] de 09 - 4000 3500 3000 1500 1000 500 2500 2000 WAVENUMBER (cm-1) Structure: Reasoning 1.0000 2.1934 6.1 160 6.1125 5.1098 6.1008 5.0982 6,0956 5.0867 5.0840 6.0814 3.7317 3.7197 3.7109 3.7054 3.6970 3.6884 3.6846 3.6752 3.6685 3.6610 3.6544 3.6400 2.0548 2.0412 2.0267 2.0114 1.9941 1.9800 1.9629 1.9483 1.9335 1.9193 1.6840 1.6539 1.6428 1.6392 1.6278 1.6054 1.5900 1.5790 1.5660 1.5529 1.4225 1.4071 1.3955 1.3925 - 1.3810 - 1.3696 -1.3562 - 1.3427 1.3358 - 1.3320 - 1.3234 - 1.2181 1.2032 1.1998 1.1963 1.1880 1.1844 1.1808 1.1691 - 1.1813 - 1.1876 1.1641 - 0.9164 0.9023 102.2467 5 0882 2.1498 1.0985 27es (PIDAD 'ZHW 00S) WNH, 2.0 2.2467 TSS| 2.0548 - 2.0412 2.0257 2.0114 1.9941 1.9800 1.9629 1.9483 1.9335 1.9193 3.1114 : 5.0658 1.6 1.6840 1.6539 1.6428 1.6392 1.6278 1.6054 1.5900 1.5790 = 1.5660 1.5529 1.4225 1.4071 -1.3955 1.3925 1.3810 1.3696 1.3552 1.3427 1.3358 1.3320 1.3234 1.2151 1.2032 1.1998 1.1963 1.1880 1.1844 1.1808 1.1691 1.1613 1.1576 1.1541 2.1499 LLLLLLLLL UL 1,0665 215 0.9164 0.9023 [ u0|80i popupdx AWN H C NMR (125 MHz, CDCI): 17.6589 19.5073 28.4441 28.7402 29.1218 IY 37.1950 39.8830 61.2085 - 100 124.6851 131.3049 NOTE: the resolution of the lines in the "SC NMR spectrum is low, so they look doubled at the base of the peaks, but they are single lines (or peaks). Check peak picking values in red (at top of peaks) to verify that they are single peaks or not