

Answered step by step
Verified Expert Solution
Question
1 Approved Answer
Using Java to read data file, and summary statistcs such MAX,MIN, MEAN AND STANDARD DEVIATION: r f m t c 2 50 12500 98 1
Using Java to read data file, and summary statistcs such MAX,MIN, MEAN AND STANDARD DEVIATION:
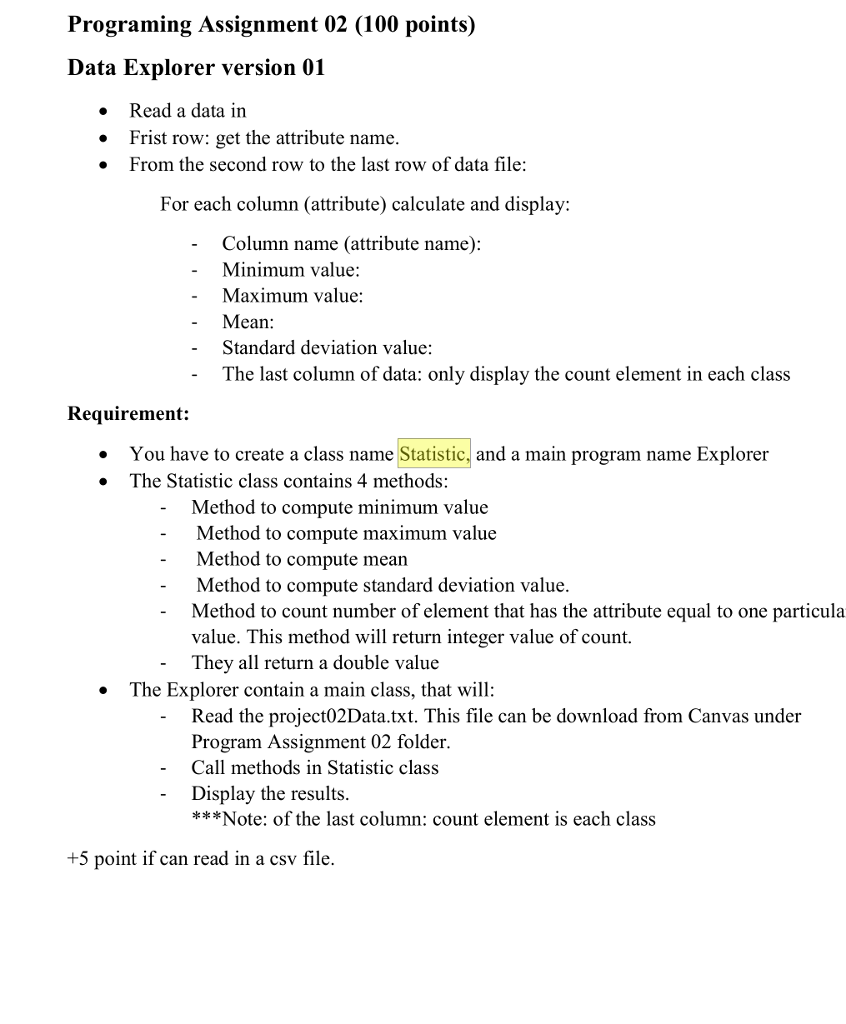
| r | f | m | t | c |
| 2 | 50 | 12500 | 98 | 1 |
| 0 | 13 | 3250 | 28 | 1 |
| 1 | 16 | 4000 | 35 | 1 |
| 2 | 20 | 5000 | 45 | 1 |
| 1 | 24 | 6000 | 77 | 0 |
| 4 | 4 | 1000 | 4 | 0 |
| 2 | 7 | 1750 | 14 | 1 |
| 1 | 12 | 3000 | 35 | 0 |
| 2 | 9 | 2250 | 22 | 1 |
| 5 | 46 | 11500 | 98 | 1 |
| 4 | 23 | 5750 | 58 | 0 |
| 0 | 3 | 750 | 4 | 0 |
| 2 | 10 | 2500 | 28 | 1 |
| 1 | 13 | 3250 | 47 | 0 |
| 2 | 6 | 1500 | 15 | 1 |
| 2 | 5 | 1250 | 11 | 1 |
| 2 | 14 | 3500 | 48 | 1 |
| 2 | 15 | 3750 | 49 | 1 |
| 2 | 6 | 1500 | 15 | 1 |
| 2 | 3 | 750 | 4 | 1 |
| 2 | 3 | 750 | 4 | 1 |
| 4 | 11 | 2750 | 28 | 0 |
| 2 | 6 | 1500 | 16 | 1 |
| 2 | 6 | 1500 | 16 | 1 |
| 9 | 9 | 2250 | 16 | 0 |
| 4 | 14 | 3500 | 40 | 0 |
| 4 | 6 | 1500 | 14 | 0 |
| 4 | 12 | 3000 | 34 | 1 |
| 4 | 5 | 1250 | 11 | 1 |
| 4 | 8 | 2000 | 21 | 0 |
| 1 | 14 | 3500 | 58 | 0 |
| 4 | 10 | 2500 | 28 | 1 |
| 4 | 10 | 2500 | 28 | 1 |
| 4 | 9 | 2250 | 26 | 1 |
| 2 | 16 | 4000 | 64 | 0 |
| 2 | 8 | 2000 | 28 | 1 |
| 2 | 12 | 3000 | 47 | 1 |
| 4 | 6 | 1500 | 16 | 1 |
| 2 | 14 | 3500 | 57 | 1 |
| 4 | 7 | 1750 | 22 | 1 |
| 2 | 13 | 3250 | 53 | 1 |
| 2 | 5 | 1250 | 16 | 0 |
| 2 | 5 | 1250 | 16 | 1 |
| 2 | 5 | 1250 | 16 | 0 |
| 4 | 20 | 5000 | 69 | 1 |
| 4 | 9 | 2250 | 28 | 1 |
| 2 | 9 | 2250 | 36 | 0 |
| 2 | 2 | 500 | 2 | 0 |
| 2 | 2 | 500 | 2 | 0 |
| 2 | 2 | 500 | 2 | 0 |
| 2 | 11 | 2750 | 46 | 0 |
| 2 | 11 | 2750 | 46 | 1 |
| 2 | 6 | 1500 | 22 | 0 |
| 2 | 12 | 3000 | 52 | 0 |
| 4 | 5 | 1250 | 14 | 1 |
| 4 | 19 | 4750 | 69 | 1 |
| 4 | 8 | 2000 | 26 | 1 |
| 2 | 7 | 1750 | 28 | 1 |
| 2 | 16 | 4000 | 81 | 0 |
| 3 | 6 | 1500 | 21 | 0 |
| 2 | 7 | 1750 | 29 | 0 |
| 2 | 8 | 2000 | 35 | 1 |
| 2 | 10 | 2500 | 49 | 0 |
| 4 | 5 | 1250 | 16 | 1 |
| 2 | 3 | 750 | 9 | 1 |
| 3 | 16 | 4000 | 74 | 0 |
| 2 | 4 | 1000 | 14 | 1 |
| 0 | 2 | 500 | 4 | 0 |
| 4 | 7 | 1750 | 25 | 0 |
| 1 | 9 | 2250 | 51 | 0 |
| 2 | 4 | 1000 | 16 | 0 |
| 2 | 4 | 1000 | 16 | 0 |
| 4 | 17 | 4250 | 71 | 1 |
| 2 | 2 | 500 | 4 | 0 |
| 2 | 2 | 500 | 4 | 1 |
| 2 | 2 | 500 | 4 | 1 |
| 2 | 4 | 1000 | 16 | 1 |
| 2 | 2 | 500 | 4 | 0 |
| 2 | 2 | 500 | 4 | 0 |
| 2 | 2 | 500 | 4 | 0 |
| 4 | 6 | 1500 | 23 | 1 |
| 2 | 4 | 1000 | 16 | 0 |
| 2 | 4 | 1000 | 16 | 0 |
| 2 | 4 | 1000 | 16 | 0 |
| 2 | 6 | 1500 | 28 | 1 |
| 2 | 6 | 1500 | 28 | 0 |
| 4 | 2 | 500 | 4 | 0 |
| 4 | 2 | 500 | 4 | 0 |
| 4 | 2 | 500 | 4 | 0 |
| 2 | 7 | 1750 | 35 | 1 |
| 4 | 2 | 500 | 4 | 1 |
| 4 | 2 | 500 | 4 | 0 |
| 4 | 2 | 500 | 4 | 0 |
| 4 | 2 | 500 | 4 | 0 |
| 12 | 11 | 2750 | 23 | 0 |
| 4 | 7 | 1750 | 28 | 0 |
| 3 | 17 | 4250 | 86 | 0 |
| 4 | 9 | 2250 | 38 | 1 |
| 4 | 4 | 1000 | 14 | 1 |
| 5 | 7 | 1750 | 26 | 1 |
Step by Step Solution
There are 3 Steps involved in it
Step: 1

Get Instant Access to Expert-Tailored Solutions
See step-by-step solutions with expert insights and AI powered tools for academic success
Step: 2

Step: 3
Ace Your Homework with AI
Get the answers you need in no time with our AI-driven, step-by-step assistance
Get Started
Intelligent Information And Database Systems 6th Asian Conference Aciids 2014 Bangkok Thailand April 7 9 2014 Proceedings Part I 9 2014 Proceedings Part 1 Lnai 8397
Authors: Ngoc-Thanh Nguyen ,Boonwat Attachoo ,Bogdan Trawinski ,Kulwadee Somboonviwat
2014th Edition
3319054759, 978-3319054759