Answered step by step
Verified Expert Solution
Link Copied!

Question

1 Approved Answer

Using Labview program Question-5: Design a VI which plots the following equation, with variable x on X-axis and variable y on Y-axis, For loop can

Using Labview program image text in transcribed
Question-5: Design a VI which plots the following equation, with variable x on X-axis and variable y on Y-axis, For loop can be used for X-axis values For equation implementation, you need to use "Expression Node" For plotting, you can use "Express XY Graph" from front pannel window. Question-5: Design a VI which plots the following equation, with variable x on X-axis and variable y on Y-axis, For loop can be used for X-axis values For equation implementation, you need to use "Expression Node" For plotting, you can use "Express XY Graph" from front pannel window

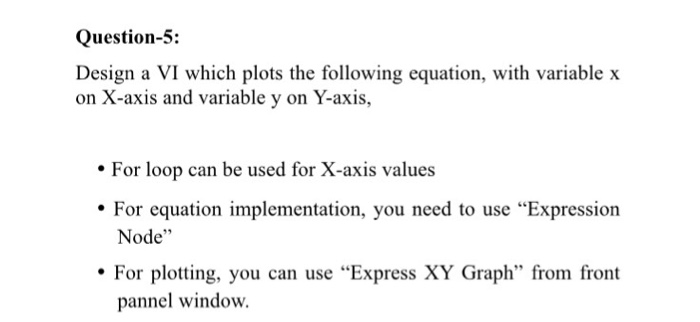
Step by Step Solution

There are 3 Steps involved in it

Step: 1

blur-text-image

Get Instant Access to Expert-Tailored Solutions

See step-by-step solutions with expert insights and AI powered tools for academic success

Step: 2

blur-text-image

Step: 3

blur-text-image

Ace Your Homework with AI

Get the answers you need in no time with our AI-driven, step-by-step assistance

Get Started

Recommended Textbook for

The Accidental Data Scientist

Authors: Amy Affelt

1st Edition

1573877077, 9781573877077

More Books

Students also viewed these Databases questions

Question

Identify specific IT applications for HR planning.

Answered: 1 week ago