Using MATLAB:

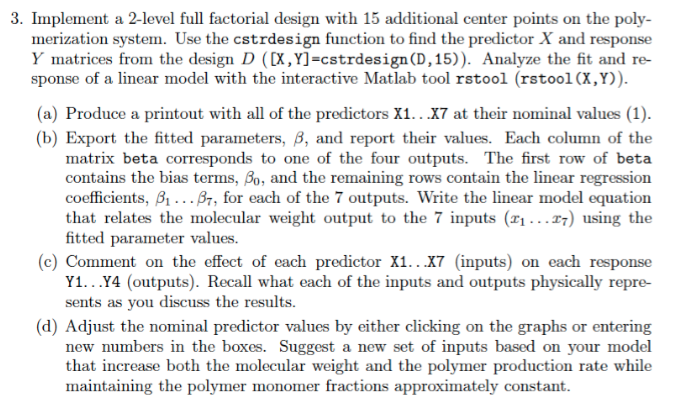
3. Implement a 2-level full factorial design with 15 additional center points on the poly- merization system. Use the cstrdesign function to find the predictor X and response Y matrices from the design D (DX, Yl-cstrdesign (D,15)). Analyze the fit and re- sponse of a linear model with the interactive Matlab tool rstool (rstool (X,Y)) (a) Produce a printout with all of the predictors Xi. .X7 at their nominal values (1) (b) Export the fitted parameters, ?, and report their values. Each column of the matrix beta corresponds to one of the four outputs. The first row of beta contains the bias terms, Po, and the remaining rows contain the linear regression coefficients, A . . .Pr, for each of the 7 outputs. Write the linear model equation that relates the molecular weight output to the 7 inputs (x1.. .7 using the fitted parameter values. (c) Comment on the effect of each predictor X1.. .X7 (inputs) on each response Y1...Y4 (outputs). Recall what each of the inputs and outputs physically repre- sents as you discuss the results. (d) Adjust the nominal predictor values by either clicking on the graphs or entering model that increase both the molecular weight and the polymer production rate while new numbers in the boxes. Suggest a new set of inputs based on your maintaining the polymer monomer fractions approximately constant 3. Implement a 2-level full factorial design with 15 additional center points on the poly- merization system. Use the cstrdesign function to find the predictor X and response Y matrices from the design D (DX, Yl-cstrdesign (D,15)). Analyze the fit and re- sponse of a linear model with the interactive Matlab tool rstool (rstool (X,Y)) (a) Produce a printout with all of the predictors Xi. .X7 at their nominal values (1) (b) Export the fitted parameters, ?, and report their values. Each column of the matrix beta corresponds to one of the four outputs. The first row of beta contains the bias terms, Po, and the remaining rows contain the linear regression coefficients, A . . .Pr, for each of the 7 outputs. Write the linear model equation that relates the molecular weight output to the 7 inputs (x1.. .7 using the fitted parameter values. (c) Comment on the effect of each predictor X1.. .X7 (inputs) on each response Y1...Y4 (outputs). Recall what each of the inputs and outputs physically repre- sents as you discuss the results. (d) Adjust the nominal predictor values by either clicking on the graphs or entering model that increase both the molecular weight and the polymer production rate while new numbers in the boxes. Suggest a new set of inputs based on your maintaining the polymer monomer fractions approximately constant


