

Answered step by step
Verified Expert Solution
Question
1 Approved Answer
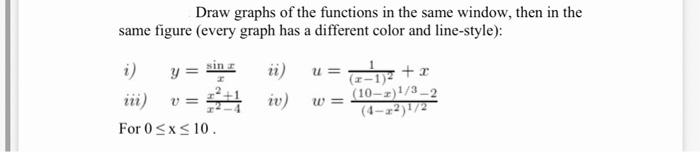
using Matlab Draw graphs of the functions in the same window, then in the same figure (every graph has a different color and line-style): y
using Matlab
Step by Step Solution
There are 3 Steps involved in it
Step: 1

Get Instant Access to Expert-Tailored Solutions
See step-by-step solutions with expert insights and AI powered tools for academic success
Step: 2

Step: 3
Ace Your Homework with AI
Get the answers you need in no time with our AI-driven, step-by-step assistance
Get Started
Advances In Databases And Information Systems 23rd European Conference Adbis 2019 Bled Slovenia September 8 11 2019 Proceedings Lncs 11695
Authors: Tatjana Welzer ,Johann Eder ,Vili Podgorelec ,Aida Kamisalic Latific
1st Edition
3030287297, 978-3030287290