

Answered step by step
Verified Expert Solution
Question
1 Approved Answer
Using Matlab how do you do: Exercise 11: Plot the following three graphs in one figure using the subplot command. 1) In the first plot,
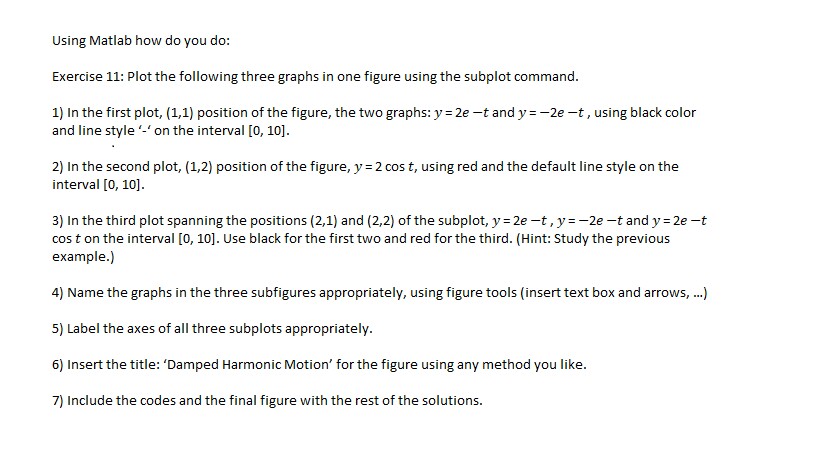
Using Matlab how do you do: Exercise 11: Plot the following three graphs in one figure using the subplot command. 1) In the first plot, (1,1) position of the figure, the two graphs: y-2e-t and y=-2e-t, using black color and line styleon the interval [0, 10] 2) In the second plot, (1,2) position of the figure, y 2 cos t, using red and the default line style on the interval [0, 10] 3) In the third plot spanning the positions (2,1) and (2,2) of the subplot, y-2e-t , y =-2e-t and y= 2e-t cos t on the interval [0, 10]. Use black for the first two and red for the third. (Hint: Study the previous example.) 4) Name the graphs in the three subfigures appropriately, using figure tools (insert text box and arrows, . 5) Label the axes of all three subplots appropriately. 6) Insert the title: 'Damped Harmonic Motion' for the figure using any method you like. 7) Include the codes and the final figure with the rest of the solutions
Step by Step Solution
There are 3 Steps involved in it
Step: 1

Get Instant Access to Expert-Tailored Solutions
See step-by-step solutions with expert insights and AI powered tools for academic success
Step: 2

Step: 3
Ace Your Homework with AI
Get the answers you need in no time with our AI-driven, step-by-step assistance
Get Started
Database Systems For Advanced Applications Dasfaa 2022 International Workshops Bdms Bdqm Gdma Iwbt Maqtds And Pmbd Virtual Event April 11 14 2022 Proceedings Lncs 13248
Authors: Uday Kiran Rage ,Vikram Goyal ,P. Krishna Reddy
1st Edition
3031112164, 978-3031112164