

Answered step by step
Verified Expert Solution
Question
1 Approved Answer
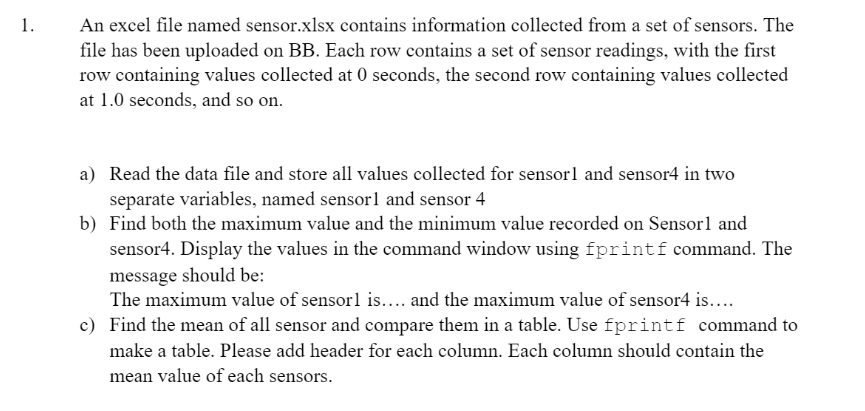
USING MATLAB!!! https://docs.google.com/spreadsheets/d/10d8OqbHphRA5iwtrnPwxGx4zQlGpPxy2FqTRVCcNXR4/edit?usp=sharing 1. An excel file named sensor.xlsx contains information collected from a set of sensors. The file has been uploaded on BB. Each
USING MATLAB!!!
https://docs.google.com/spreadsheets/d/10d8OqbHphRA5iwtrnPwxGx4zQlGpPxy2FqTRVCcNXR4/edit?usp=sharing
Step by Step Solution
There are 3 Steps involved in it
Step: 1

Get Instant Access to Expert-Tailored Solutions
See step-by-step solutions with expert insights and AI powered tools for academic success
Step: 2

Step: 3
Ace Your Homework with AI
Get the answers you need in no time with our AI-driven, step-by-step assistance
Get Started
Principles Of Database Systems With Internet And Java Applications
Authors: Greg Riccardi
1st Edition
020161247X, 978-0201612479