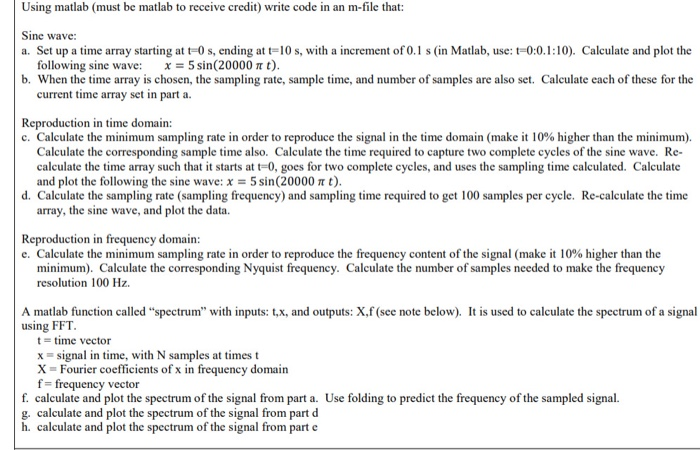
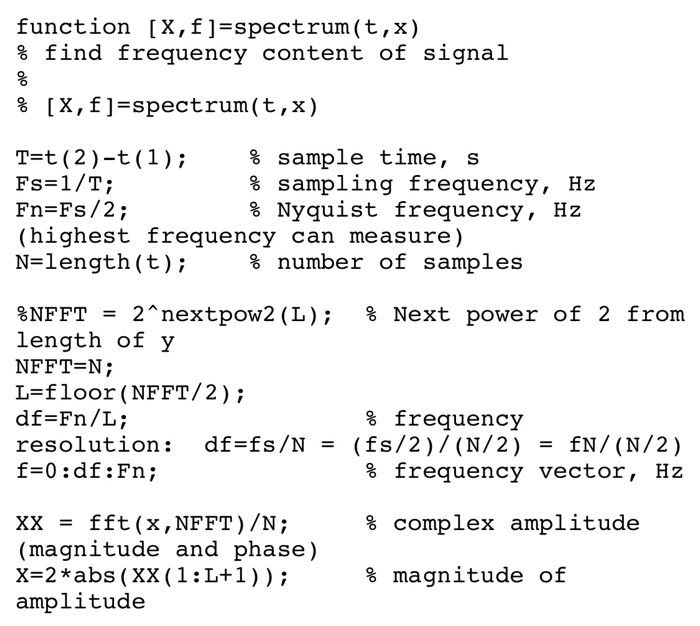
Using matlab (must be matlab to receive credit) write code in an m-file that: Sine wave: a. Set up a time array starting at t=0 sending at t=10 s, with a increment of 0.1 s (in Matlab, use: t=0:0.1:10). Calculate and plot the following sine wave: x = 5 sin(20000 it). b. When the time array is chosen, the sampling rate, sample time, and number of samples are also set. Calculate each of these for the current time array set in part a. Reproduction in time domain: c. Calculate the minimum sampling rate in order to reproduce the signal in the time domain (make it 10% higher than the minimum). Calculate the corresponding sample time also. Calculate the time required to capture two complete cycles of the sine wave. Re- calculate the time array such that it starts at t-0, goes for two complete cycles, and uses the sampling time calculated. Calculate and plot the following the sine wave: x = 5 sin(20000 it). d. Calculate the sampling rate (sampling frequency) and sampling time required to get 100 samples per cycle. Re-calculate the time array, the sine wave, and plot the data. Reproduction in frequency domain: c. Calculate the minimum sampling rate in order to reproduce the frequency content of the signal (make it 10% higher than the minimum). Calculate the corresponding Nyquist frequency. Calculate the number of samples needed to make the frequency resolution 100 Hz. A matlab function called "spectrum" with inputs: t,x, and outputs: X,f (see note below). It is used to calculate the spectrum of a signal using FFT. t = time vector x=signal in time, with N samples at timest X-Fourier coefficients of x in frequency domain f=frequency vector f. calculate and plot the spectrum of the signal from part a. Use folding to predict the frequency of the sampled signal. g. calculate and plot the spectrum of the signal from part d h. calculate and plot the spectrum of the signal from parte function [X,f]=spectrum(t, x) % find frequency content of signal % [X,f]=spectrum(t, x) T=t(2)-t(1); % sample time, s Fs=1/T; % sampling frequency, Hz Fn=Fs/2; % Nyquist frequency, HZ (highest frequency can measure) N=length(t); % number of samples % Next power of 2 from %NFFT = 2^nextpow2 (L); length of y NFFT=N; L=floor (NFFT/2); df=Fn/L; resolution: df=fs/N = f=0:df:Fn; % frequency (fs/2)/(N/2) = fN/(N/2) % frequency vector, HZ olo % complex amplitude XX = fft(x,NFFT) /N; (magnitude and phase) X=2 *abs (XX (1:L+1)); amplitude % magnitude of Using matlab (must be matlab to receive credit) write code in an m-file that: Sine wave: a. Set up a time array starting at t=0 sending at t=10 s, with a increment of 0.1 s (in Matlab, use: t=0:0.1:10). Calculate and plot the following sine wave: x = 5 sin(20000 it). b. When the time array is chosen, the sampling rate, sample time, and number of samples are also set. Calculate each of these for the current time array set in part a. Reproduction in time domain: c. Calculate the minimum sampling rate in order to reproduce the signal in the time domain (make it 10% higher than the minimum). Calculate the corresponding sample time also. Calculate the time required to capture two complete cycles of the sine wave. Re- calculate the time array such that it starts at t-0, goes for two complete cycles, and uses the sampling time calculated. Calculate and plot the following the sine wave: x = 5 sin(20000 it). d. Calculate the sampling rate (sampling frequency) and sampling time required to get 100 samples per cycle. Re-calculate the time array, the sine wave, and plot the data. Reproduction in frequency domain: c. Calculate the minimum sampling rate in order to reproduce the frequency content of the signal (make it 10% higher than the minimum). Calculate the corresponding Nyquist frequency. Calculate the number of samples needed to make the frequency resolution 100 Hz. A matlab function called "spectrum" with inputs: t,x, and outputs: X,f (see note below). It is used to calculate the spectrum of a signal using FFT. t = time vector x=signal in time, with N samples at timest X-Fourier coefficients of x in frequency domain f=frequency vector f. calculate and plot the spectrum of the signal from part a. Use folding to predict the frequency of the sampled signal. g. calculate and plot the spectrum of the signal from part d h. calculate and plot the spectrum of the signal from parte function [X,f]=spectrum(t, x) % find frequency content of signal % [X,f]=spectrum(t, x) T=t(2)-t(1); % sample time, s Fs=1/T; % sampling frequency, Hz Fn=Fs/2; % Nyquist frequency, HZ (highest frequency can measure) N=length(t); % number of samples % Next power of 2 from %NFFT = 2^nextpow2 (L); length of y NFFT=N; L=floor (NFFT/2); df=Fn/L; resolution: df=fs/N = f=0:df:Fn; % frequency (fs/2)/(N/2) = fN/(N/2) % frequency vector, HZ olo % complex amplitude XX = fft(x,NFFT) /N; (magnitude and phase) X=2 *abs (XX (1:L+1)); amplitude % magnitude of


