Answered step by step
Verified Expert Solution
Link Copied!

Question

1 Approved Answer

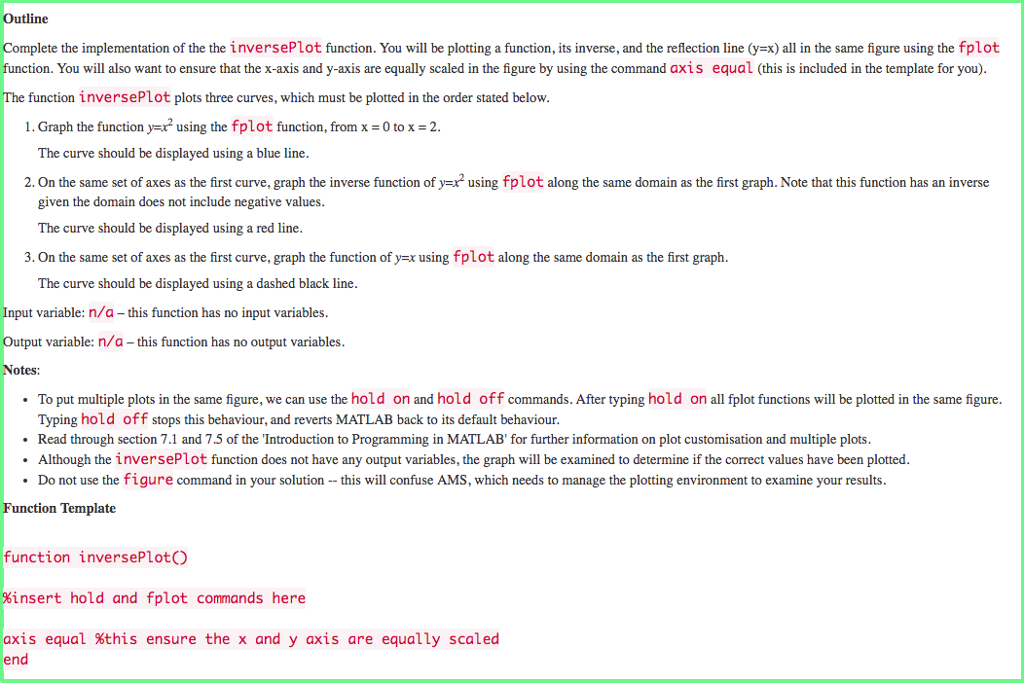
USING MATLAB: Outline Complete the implementation of the the inversePlot function. You will be plotting a function, its inverse, and the reflection line (y-x) all

USING MATLAB:

image text in transcribed

Outline Complete the implementation of the the inversePlot function. You will be plotting a function, its inverse, and the reflection line (y-x) all in the same figure using the fplot unction. You will also want to ensure that the x-axis and y-axis are equally scaled in the figure by using the command axis equal (this is included in the template for you). function inversePlot plots three curves, which must be plotted in the order stated below. 1. Graph the function y- using the fplot function, from x 0 to x 2 The curve should be displayed using a blue line e t of a u,gaphthe iverne function of yurusing fplot along the same domain a he ins graph.Nate thatene given the domain does not include negative values The curve should be displayed using a red line 3. On the same set of axes as the first curve, graph the function of yx using fplot along the same domain as the first graph The curve should be displayed using a dashed black line. nput variable: n/a -this function has no input variables utput variable: n/a -this function has no output variables Notes: To put multiple plots in the same figure, we can use the hold on and hold off commands. After typing hold on all fplot functions will be plotted in the same figure. Typing hold off stops this behaviour, and reverts MATLAB back to its default behaviour. Read through section 7.1 and 7.5 of the 'Introduction to Programming in MATLAB' for further information on plot customisation and multiple plots Although the inversePlot function does not have any output variables, the graph will be examined to determine if the correct values have been plotted. Do not use the figure command in your solution -this will confuse AMS, which needs to manage the plotting environment to examine your results. Function Template function inversePlot %insert hold and fplot commands here xis equal this ensure the x and y axis are equally scaled end

Step by Step Solution

There are 3 Steps involved in it

Step: 1

blur-text-image

Get Instant Access to Expert-Tailored Solutions

See step-by-step solutions with expert insights and AI powered tools for academic success

Step: 2

blur-text-image

Step: 3

blur-text-image

Ace Your Homework with AI

Get the answers you need in no time with our AI-driven, step-by-step assistance

Get Started

Recommended Textbook for

DNA Databases

Authors: Stefan Kiesbye

1st Edition

0737758910, 978-0737758917

More Books

Students also viewed these Databases questions

Question

4. Describe how cultural values influence communication.

Answered: 1 week ago