

Answered step by step
Verified Expert Solution
Question
1 Approved Answer
USING MATLAB. please include screenshot of codes and graphs g(0) 1 2. Write another m-file MATLAB script [i.e., a modification of the script in (1)
USING MATLAB. please include screenshot of codes and graphs
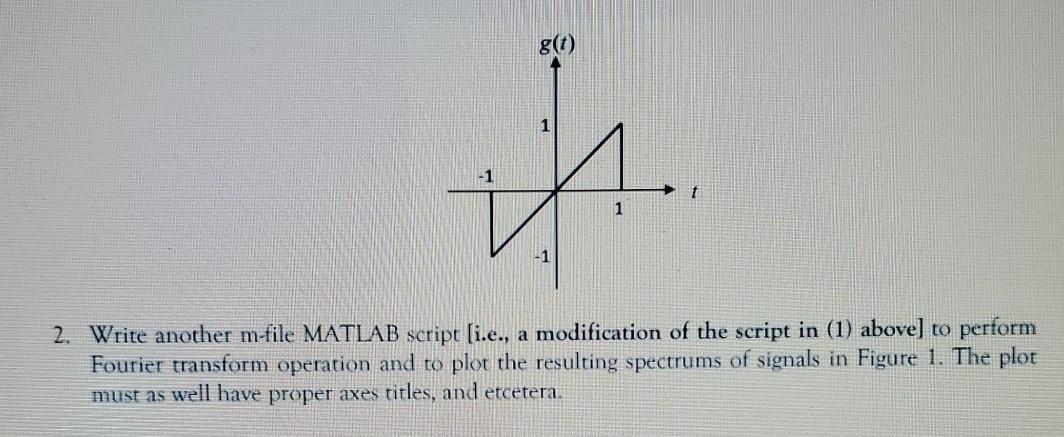
g(0) 1 2. Write another m-file MATLAB script [i.e., a modification of the script in (1) above) to perform Fourier transform operation and to plot the resulting spectrums of signals in Figure 1. The plot must as well have proper axes titles, and etcetera
Step by Step Solution
There are 3 Steps involved in it
Step: 1

Get Instant Access to Expert-Tailored Solutions
See step-by-step solutions with expert insights and AI powered tools for academic success
Step: 2

Step: 3
Ace Your Homework with AI
Get the answers you need in no time with our AI-driven, step-by-step assistance
Get Started
Database In Depth Relational Theory For Practitioners
Authors: C.J. Date
1st Edition
0596100124, 978-0596100124