

Answered step by step
Verified Expert Solution
Question
1 Approved Answer
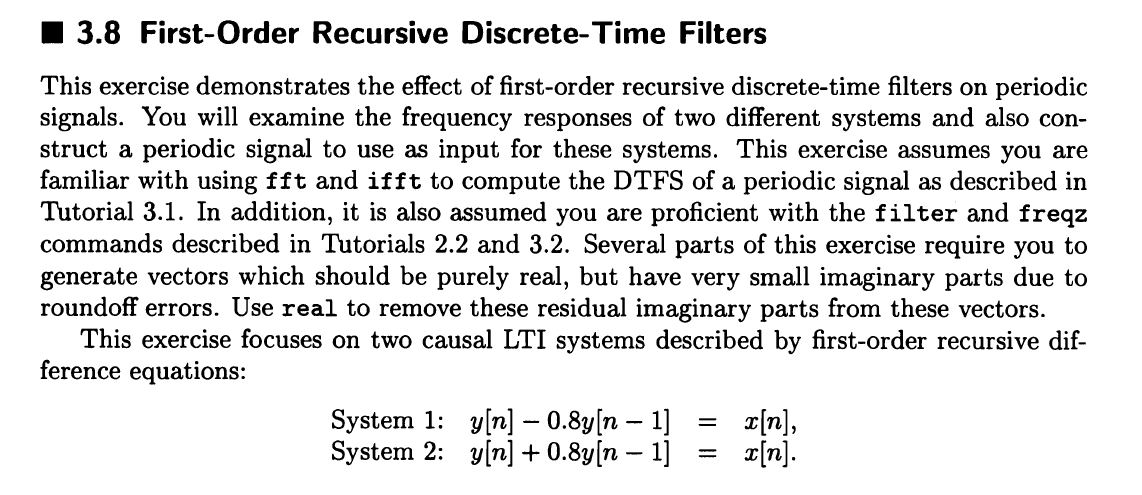
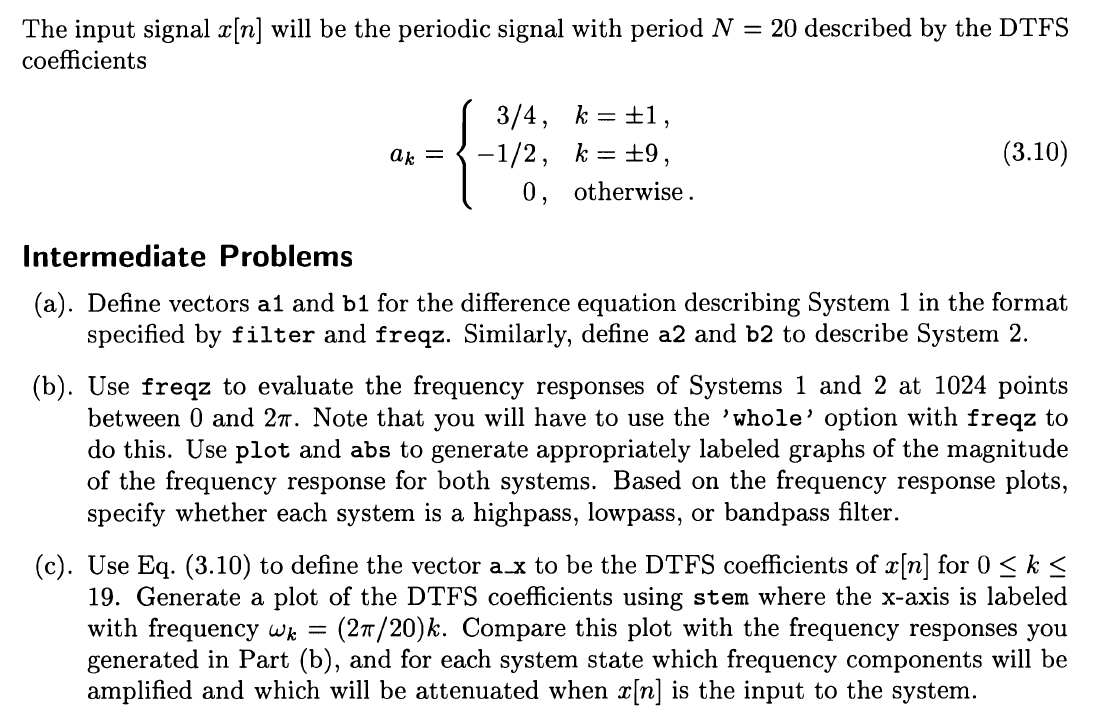
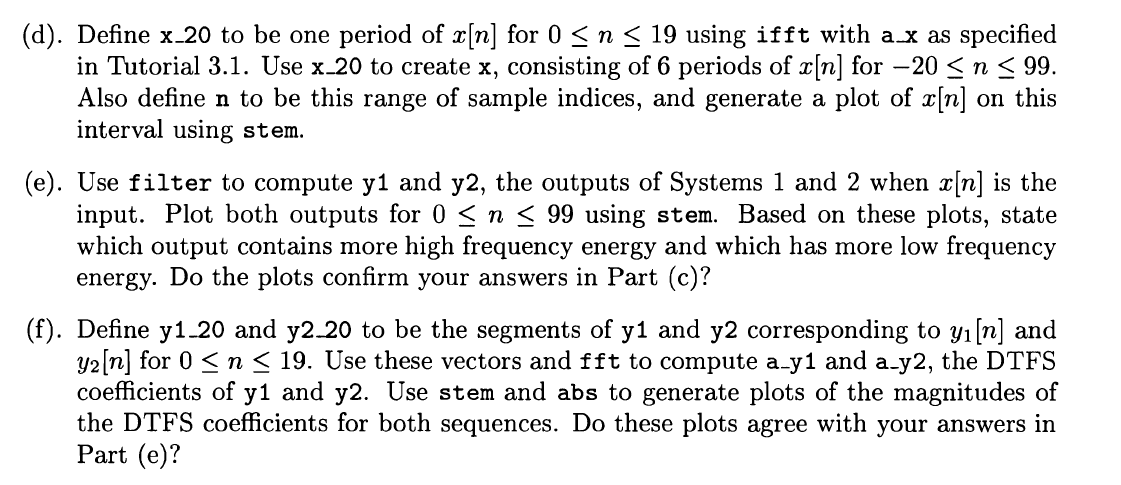
Using MATLAB signals and systems textbook: computer explorations in signals and systems using matlab 13.8 First-Order Recursive Discrete-Time Filters This exercise demonstrates the effect of
Using MATLAB signals and systems
textbook: computer explorations in signals and systems using matlab
Step by Step Solution
There are 3 Steps involved in it
Step: 1

Get Instant Access to Expert-Tailored Solutions
See step-by-step solutions with expert insights and AI powered tools for academic success
Step: 2

Step: 3
Ace Your Homework with AI
Get the answers you need in no time with our AI-driven, step-by-step assistance
Get Started
Oracle Databases On The Web Learn To Create Web Pages That Interface With Database Engines
Authors: Robert Papaj, Donald Burleson
11th Edition
1576100995, 978-1576100998