Answered step by step
Verified Expert Solution
Link Copied!

Question

1 Approved Answer

Using MATLAB You should be able to run it as python P3.py 1 2.5 5, which will generate 3 curves on the same figure. Plot

Using MATLAB
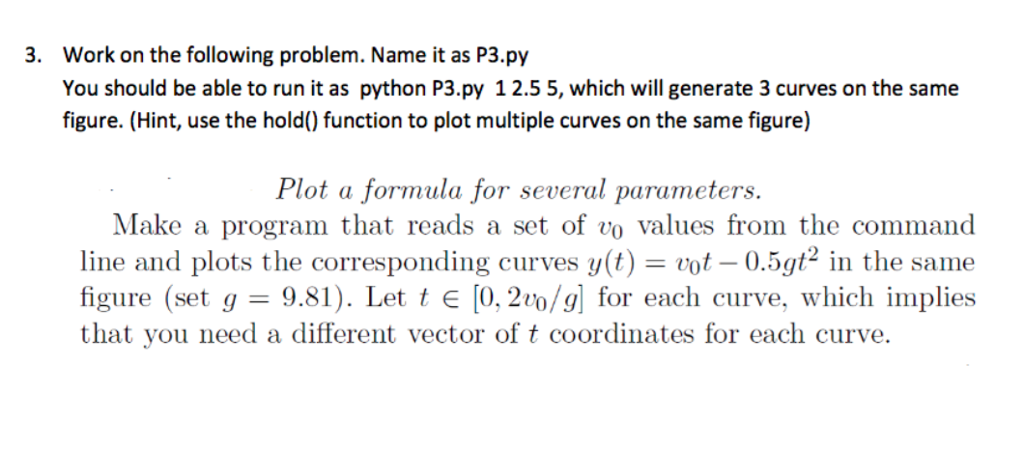
image text in transcribed

You should be able to run it as python P3.py 1 2.5 5, which will generate 3 curves on the same figure. Plot a formula for several parameters. Make a program that reads a set of upsilon_0 values from the command line and plots the corresponding curves y(t) = upsilon_0 t - 0.5gt^2 in the same figure (set g = 9.81). Let t elementof [0, 2 upsilon_0/g] for each curve, which implies that you need a different vector of t coordinates for each curve

Step by Step Solution

There are 3 Steps involved in it

Step: 1

blur-text-image

Get Instant Access to Expert-Tailored Solutions

See step-by-step solutions with expert insights and AI powered tools for academic success

Step: 2

blur-text-image

Step: 3

blur-text-image

Ace Your Homework with AI

Get the answers you need in no time with our AI-driven, step-by-step assistance

Get Started

Recommended Textbook for

Programming The Perl DBI Database Programming With Perl

Authors: Tim Bunce, Alligator Descartes

1st Edition

1565926994, 978-1565926998

More Books

Students also viewed these Databases questions

Question

3. Would you say that effective teamwork saved their lives?

Answered: 1 week ago