

Answered step by step
Verified Expert Solution
Question
1 Approved Answer
Using only 2017 financials please put answer in a format that is clear and readable company is Chipotle as listed only in the text not
Using only 2017 financials 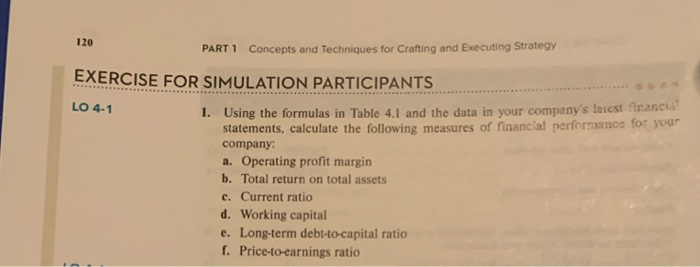

please put answer in a format that is clear and readable
company is Chipotle as listed only in the text not online
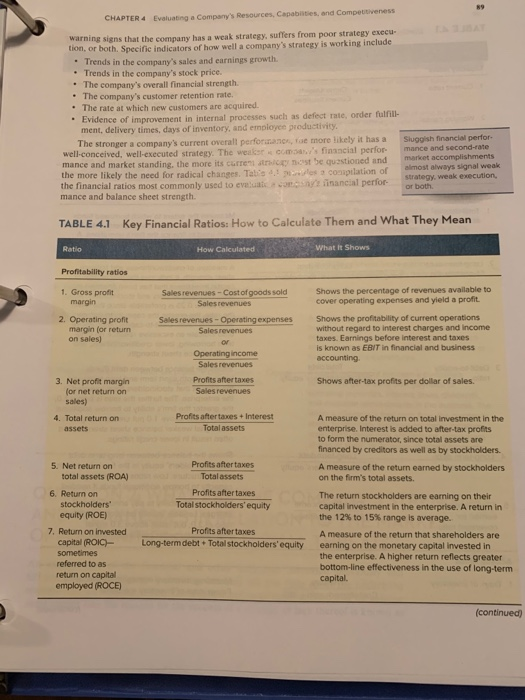
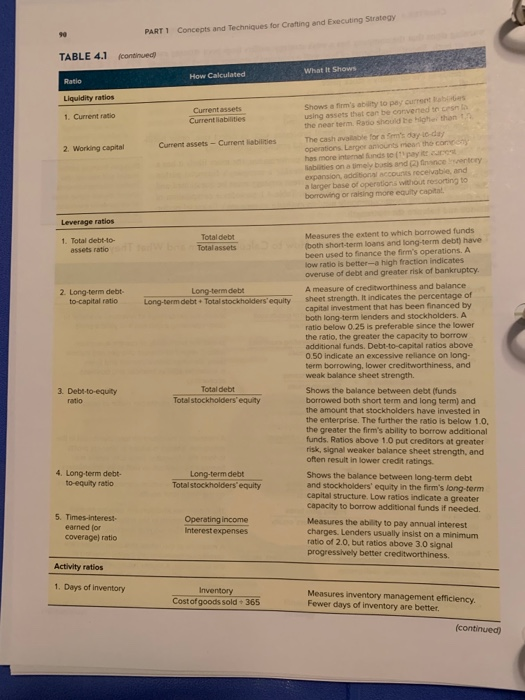
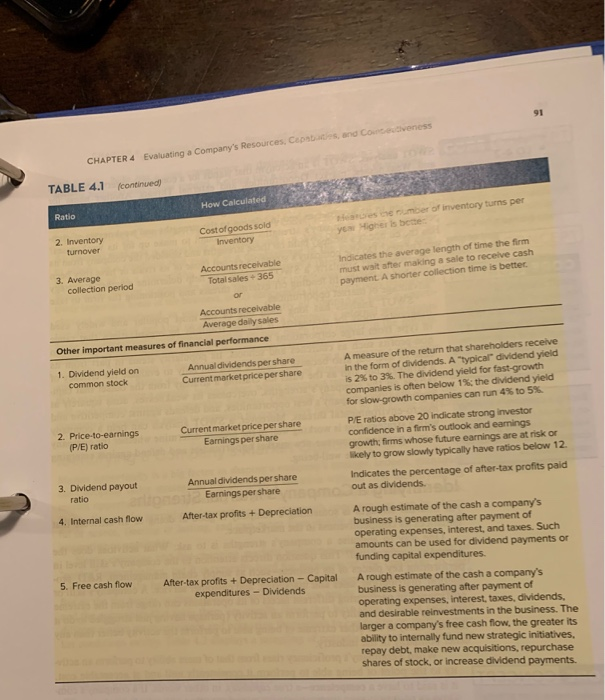
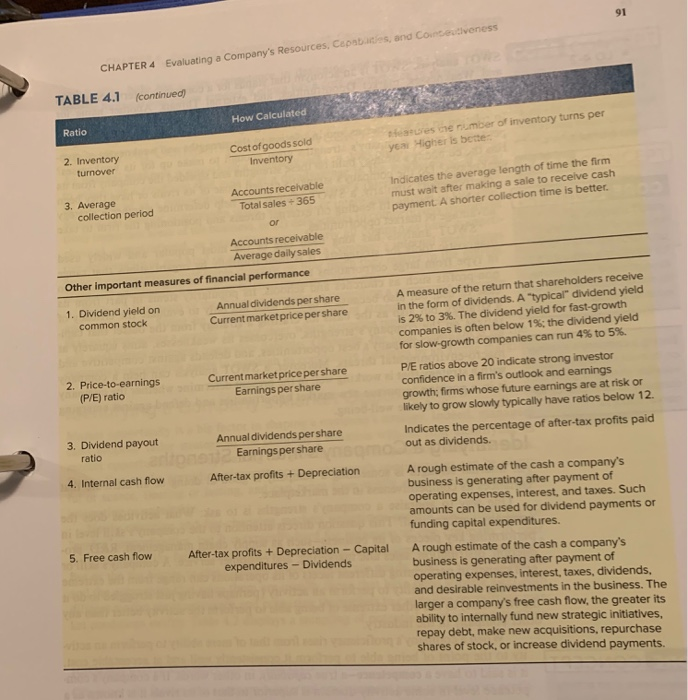
120 PART 1 Concepts and Techniques for Crafting and Executing Strategy EXERCISE FOR SIMULATION PARTICIPANTS LO 4-1 1. Using the formulas in Table 4.1 and the data in your company's latest financia statements, calculate the following measures of financial performance for your company: a. Operating profit margin b. Total return on total assets c. Current ratio d. Working capital e. Long-term debt-to-capital ratio f. Price-to-earnings ratio CHAPTER 4 Evaluating a Company's Resources, Capabilities, and Competitiveness warning signs that the company has a weak strategy, suffers from poor strategy execu- tion, or both. Specific indicators of how well a company's strategy is working include Trends in the company's sales and earnings growth Trends in the company's stock price. The company's overall financial strength. The company's customer retention rate. The rate at which new customers are acquired. Evidence of improvement in internal processes such as defect rate, order fulfill- ment, delivery times, days of inventory, and employee productivity The stronger a company's current overall performanc e more likely it has a Sluggish financial perfor well-conceived, well-executed strategy. The weak com financial perfor mance and second-tate mance and market standing, the more its curren t be questioned and market accomplishments almost always signal weak the more likely the need for radical changes. Talis 1 2 compilation of strategy, weak execution, the financial ratios most commonly used to eve n inancial perfor or both mance and balance sheet strength TABLE 4.1 Key Financial Ratios: How to Calculate them and What They Mean Ratio How Calculated What it shows Profitability ratios 1. Gross profit margin Shows the percentage of revenues available to cover operating expenses and yield a profit. Sales revenues - Costof goods sold Sales revenues Sales revenues - Operating expenses Sales revenues 2. Operating profit margin (or return on sales) Shows the profitability of current operations without regard to interest charges and income taxes. Earnings before interest and taxes is known as EBIT in financial and business accounting Operating income Sales revenues Profits aftertaxes Sales revenues Shows after-tax profits per dollar of sales. 3. Net profit margin for net return on sales) 4. Total return on assets Profits after taxes + Interest Total assets A measure of the return on total investment in the enterprise. Interest is added to after-tax profits to form the numerator, since total assets are financed by creditors as well as by stockholders. Profits after taxes Total assets A measure of the return earned by stockholders on the firm's total assets. Profits after taxes Total stockholders' equity The return stockholders are earning on their capital investment in the enterprise. A return in the 12% to 15% range is average. 5. Net return on total assets (ROA) 6. Return on stockholders' equity (ROE) 7. Return on invested capital (ROIC) sometimes referred to as return on capital employed (ROCE) Profits after taxes Long-term debt + Total stockholders'equity A measure of the return that shareholders are earning on the monetary capital invested in the enterprise. A higher return reflects greater bottom-line effectiveness in the use of long-term capital (continued) PART 1 Concepts and Techniques for Crafting and Executing Strategy TABLE 4.1 continued What It Shows Ratio How Calculated Liquidity ratios 1. Current ratio Current assets Current liabilities 2. Working capital Current assets - Current liabilities Shows a firm's by to pay current using assets that can be converted to con the near term Ratio should be one than The cash available for arm's oyo-day operations Large amounts mean tho con has more internal funds to pay it ibilities on a timely basis and finance entry expansion additional accounts receivable, and a larger base of operations without resorting to borrowing or raising more equity capital Leverage ratios 1. Total debt-to- assets ratio Total debt Total assets 2. Long-term debt- to-capital ratio Long-term debt Long-term debt. Total stockholders'equity Measures the extent to which borrowed funds both short-term loans and long-term debt) have been used to finance the firm's operations. A low ratio is better-a high fraction indicates overuse of debt and greater risk of bankruptcy. A measure of creditworthiness and balance sheet strength. It indicates the percentage of capital investment that has been financed by both long term lenders and stockholders. A ratio below 0.25 is preferable since the lower the ratio, the greater the capacity to borrow additional funds. Debt-to-capital ratios above 0.50 indicate an excessive reliance on long- term borrowing, lower Creditworthiness, and weak balance sheet strength. 3. Debt-to-equity ratio Total debt Total stockholders'equity Shows the balance between debt funds borrowed both short term and long term) and the amount that stockholders have invested in the enterprise. The further the ratio is below 1.0. the greater the firm's ability to borrow additional funds. Ratios above 1.0 put creditors at greater risk, signal weaker balance sheet strength, and often result in lower credit ratings 4. Long-term debt- to-equity ratio Long-term debt Total stockholders'equity 5. Times-interest earned for coverage ratio Shows the balance between long-term debt and stockholders' equity in the firm's long-term capital structure. Low ratios indicate a greater capacity to borrow additional funds if needed. Measures the ability to pay annual interest charges. Lenders usually insist on a minimum ratio of 2.0, but ratios above 3.0 signal progressively better creditworthiness Operating income Interest expenses Activity ratios 1. Days of inventory Inventory Cost of goods sold + 365 Measures inventory management efficiency. Fewer days of inventory are better. (continued CHAPTER 4 Evaluating a company's Resources. Cepebas, and courtes veness TABLE 4.1 continued How Calculated Ratio ese mber of inventory turns per yos igers been Cost of goods sold Inventory 2. Inventory turnover Indicates the average length of time the firm must wait after making a sale to receive cash payment. A shorter collection time is better Accounts receivable Total sales - 365 3. Average collection period Accounts receivable Average daily sales Other important measures of financial performance 1. Dividend yield on common stock Annual dividends per share Current market price pershare A measure of the return that shareholders receive in the form of dividends. A typical dividend yield is 2% to 3%. The dividend yield for fast-growth companies is often below 1%: the dividend yield for slow-growth companies can run 4% to 5% PE ratios above 20 Indicate strong investor confidence in a firm's outlook and earnings growth firms whose future earnings are at risk or kely to grow slowly typically have ratios below 12. Indicates the percentage of after-tax profits paid out as dividends. 2. Price-to-earnings (P/E) ratio Current market price pershare Earnings per share 3. Dividend payout ratio Annual dividends per share Earnings per share 4. Internal cash flow After-tax profits + Depreciation 5. Free cash flow After-tax profits + Depreciation - Capital expenditures - Dividends A rough estimate of the cash a company's business is generating after payment of operating expenses, interest, and taxes. Such amounts can be used for dividend payments or funding capital expenditures. A rough estimate of the cash a company's business is generating after payment of operating expenses, interest, taxes, dividends. and desirable reinvestments in the business. The larger a company's free cash flow, the greater its ability to internally fund new strategic initiatives, repay debt, make new acquisitions, repurchase shares of stock, or increase dividend payments. CHAPTER 4 Evaluating a Company's Resources, Capabtes, and conduciveness TABLE 4.1 (continued) How Calculated Ratio es ne number of inventory turns per Higher is bette- Cost of goods sold ya Inventory 2. Inventory turnover Indicates the average length of time the firm must wait after making a sale to receive cash payment A shorter collection time is better. Accounts receivable Total sales - 365 3. Average collection period or Accounts receivable Average daily sales Other important measures of financial performance 1. Dividend yield on common stock Annual dividends per share Current market price per share A measure of the return that shareholders receive in the form of dividends. A "typical" dividend yield is 2% to 3%. The dividend yield for fast-growth companies is often below 1%; the dividend yield for slow-growth companies can run 4% to 5%. 2. Price-to-earnings (P/E) ratio Current market price per share Earnings per share P/E ratios above 20 indicate strong investor confidence in a firm's outlook and earnings growth; firms whose future earnings are at risk or likely to grow slowly typically have ratios below 12. Annual dividends per share Earnings per share Indicates the percentage of after-tax profits paid out as dividends. 3. Dividend payout ratio 4. Internal cash flow After-tax profits + Depreciation 5. Free cash flow After-tax profits + Depreciation - Capital expenditures - Dividends A rough estimate of the cash a company's business is generating after payment of operating expenses, interest, and taxes. Such amounts can be used for dividend payments or funding capital expenditures. A rough estimate of the cash a company's business is generating after payment of operating expenses, Interest, taxes, dividends. and desirable reinvestments in the business. The larger a company's free cash flow, the greater its ability to internally fund new strategic initiatives, repay debt, make new acquisitions, repurchase shares of stock, or increase dividend payments. CASE 12 Chipotle Mexican Gris Strategy in 2018 C-123 EXHIBIT 1 Financial and Operating Highlights for Chipotle Mexican Grill, 2011-2017 in ons of dollars for per share items Income Statement Data Tot revenue Food beverage and packaging costs As a venue Labor costs As of total revenue Occupancy costs As of total revenue Other operating costs As of total revenue General and administrative expenses As of total revenue Depreciation and amortization Preopening costs Loss on osa o ssets Total operating expenses Operating income As as of total revenue Interest and other income expense net income before income taxes Provision for income Net income As a of total revenue Earnings per share 2017 2016 2015 2014 2011 $4,4764 $3.9044 $4,501. 2 54108.3 $2.2696 15354 1.3656 503814210 34.36 508 33.48 3461 325 1.2000 1,1050 9044 26.9% 28.3% 23.21 22 23 23.9% 327.1 2936 2624 230.9 147.3 7.3 731 56% 6516 642.0 5150 4342 251.2 14.6% 11.45 10.6% 2964 2762 2502 149.4 7.1% 56% 67% 6,6% 1633 146.4 130.4 110.5 74,9 169 15.6 133 13.194 6.976 5806 4.2066 3,8698 3.7376 33975 19190 2708 7636 710.8 3506 6.0% 0.9% 17.01 17.3% 15.5% 3.5 10.9 on 2757 387 7699 7143 3:49.7 995) (158) 2943 268 93 1349) 1763 5229 54756 4454 2149 3.9% 0.6% 106 10.8% 9.5% 123 172 63 $ 6.19 6.17 0.78 077 $ 15 30 15 10 $ 1435 14 13 $ 689 6.76 Diluted Weighted average common shares outstanding Basic Diluted Selected Balance Sheet Data 28.5 286 29. 3 29.8 3 1.1 31.5 31.0 31.5 312 31.8 Total current assets Total assets Total current liables Totallaties Total shareholders' equity $ 629.5 2,045,7 3239 6812 1,364.4 $ 5224 2,026.1 2813 6236 1.4025 $814,6 2.725.1 2799 597.1 2.128 0 $ 8595 $5012 2.527.3 1.4253 245.7 157.5 514.9 3748 20124 1.0442 Other Financial Data Net cash provided by operating activities Capital expenditures $ 467.1 2168 $ 3492 25818 $ 683.3 2574 $ 682.1 $ 411.1 2526 151.1 Restaurant Operations Data 2.408 $1,940,0 In thousands of dollars 2.250 2.010 1.783 $1,8680 $2.424,0 $2,472,0 1,230 $2.013.0 Restaurants open at year-end Average restaurant sales Average annual sales increases at restaurants open at least 13 full calendar months Development and construction costs per newly opened restaurant $ 6.4% 835 $ (20.41% 880 $ 0.2% 805 $ 16,8% 843 $ 11.2% 800 Source Company to reports. 2015. 2016 and 2017 Step by Step Solution
There are 3 Steps involved in it
Step: 1

Get Instant Access to Expert-Tailored Solutions
See step-by-step solutions with expert insights and AI powered tools for academic success
Step: 2

Step: 3
Ace Your Homework with AI
Get the answers you need in no time with our AI-driven, step-by-step assistance
Get Started
Business Analysis And Valuation Using Financial Statements Text And Cases
Authors: Krishna G. Palepu, Paul M. Healy, Victor Lewis Bernard, W.Gordon Filby
2nd Edition
0324015658, 9780324015652