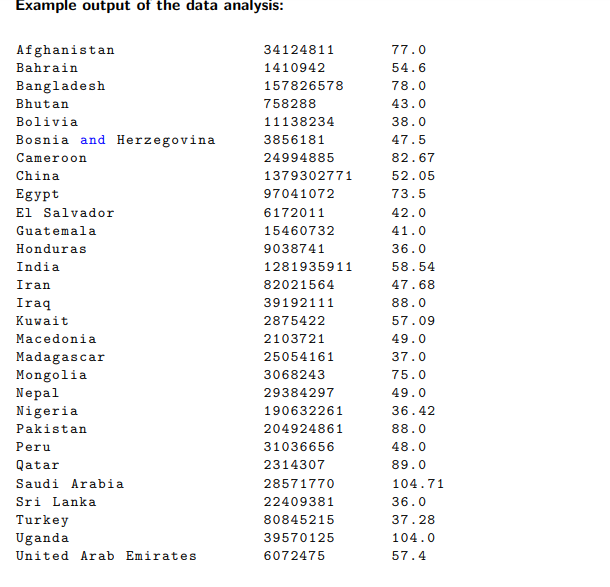
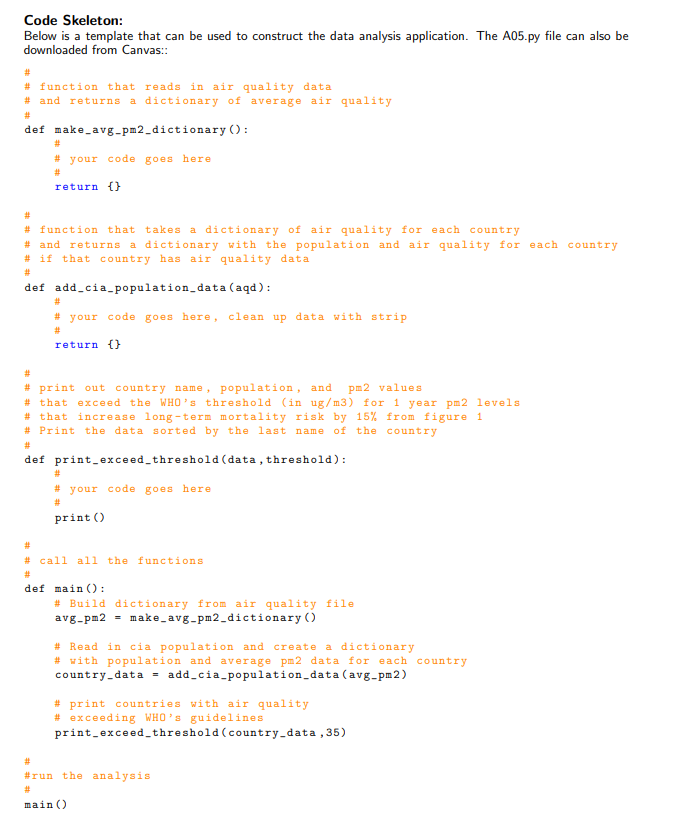
Answered step by step
Verified Expert Solution
Link Copied!

Question

1 Approved Answer

Using Python 3, please write the following code using Dictionaries. Since the assignment requires .tsv files, I can't attach them via Chegg, so I've attached

Using Python 3, please write the following code using Dictionaries. Since the assignment requires .tsv files, I can't attach them via Chegg, so I've attached them through my Dropbox link. Please download the .tsv files and help me with the following assignment: https://www.dropbox.com/s/k7tavv6sf55k7s4/air_data.tsv?dl=0 https://www.dropbox.com/s/90ybeltxa6lc81e/cia_population.tsv?dl=0 image text in transcribedimage text in transcribedimage text in transcribed

Programming Assignment 5 (100 Points): Air Quality Data Analysis Air quality around the world varies greatly and depends on many factors (e.g. geographic locale, industrial polution, etc.). The World Health Organization (WHO) publishes data provided by each country for air quality in particulate matter (PM) for two sizes 10ug/m3 and 2.5ug/m3 named PM10 and PM2.5 in our data file There are one or more readings for each country per city and year. We will combine all readings for each country and compute an aveargae PM2.5 value for the PM data stored in the air quality.tsv file. Furthermore, we will use the WHO's PM2.5 thresholds for air quality health impacts to print out countries who exceed a given threshold. See Figure 1 for the various levels WHOair quality guidelines and interim targets for particulate matter: annual mean concentrations' PM PM Basis for the selected level linterim target-1 70 35 | These levels are associated with about a 15% higher long-term mortality risk relative to the AQG level. Interim target-2 (IT-2) 50 25 In addition to other health benefits, these levels lower the risk of premature mortality by approximately 6% 1 1%) relative to them-1 level. Interim target-3 (IT-3) 30 15 In addition to other health benefits, these levels reduce the mortality risk by approximately 6% [2-11%) relative to the -IT-2 level Air quality guideline (AQG) 20 10 These are the lowest levels at which total, cardiopul- monary and lung cancer mortality have been shown to increase with more than 95% confidence in response to long-term ex to PM Figure 1: WHO air quality guidelines for particulate matter PM10 & PM2.5.(Air quality reference) We will also associate a population for each country using the CIA's world factbook database that is stored in the file cia-population.tsv (Population reference). The data files and code skeleton on page 3 are available to download from canvas Assignment Description In function make avg-pm2_dictionary() create a dictionary to store a computed average PM2.5 value for each country from all cities and year records in the file air-quality.tsv In the function add cia-population data(...) retrieve the popluation for each country with a PM2.5 value from the file cia population.tsv. The population data may need to be cleaned up using strip to remove extra quotation marks. Assemble the country name, population and PM2.5 data into a second dictionary that contains the country name as a the key and the population and PM2.5 as a list of values Finally, sort the data in the function print exceed threshold by country names and print the country name, population and PM2.5 value. Only print out the countries that exceed the WHO's threshold shown and represented in our dataset in ug/m3) for PM2.5 levels that increase long-term mortality risk by 15% shown in Figure 1 Programming Assignment 5 (100 Points): Air Quality Data Analysis Air quality around the world varies greatly and depends on many factors (e.g. geographic locale, industrial polution, etc.). The World Health Organization (WHO) publishes data provided by each country for air quality in particulate matter (PM) for two sizes 10ug/m3 and 2.5ug/m3 named PM10 and PM2.5 in our data file There are one or more readings for each country per city and year. We will combine all readings for each country and compute an aveargae PM2.5 value for the PM data stored in the air quality.tsv file. Furthermore, we will use the WHO's PM2.5 thresholds for air quality health impacts to print out countries who exceed a given threshold. See Figure 1 for the various levels WHOair quality guidelines and interim targets for particulate matter: annual mean concentrations' PM PM Basis for the selected level linterim target-1 70 35 | These levels are associated with about a 15% higher long-term mortality risk relative to the AQG level. Interim target-2 (IT-2) 50 25 In addition to other health benefits, these levels lower the risk of premature mortality by approximately 6% 1 1%) relative to them-1 level. Interim target-3 (IT-3) 30 15 In addition to other health benefits, these levels reduce the mortality risk by approximately 6% [2-11%) relative to the -IT-2 level Air quality guideline (AQG) 20 10 These are the lowest levels at which total, cardiopul- monary and lung cancer mortality have been shown to increase with more than 95% confidence in response to long-term ex to PM Figure 1: WHO air quality guidelines for particulate matter PM10 & PM2.5.(Air quality reference) We will also associate a population for each country using the CIA's world factbook database that is stored in the file cia-population.tsv (Population reference). The data files and code skeleton on page 3 are available to download from canvas Assignment Description In function make avg-pm2_dictionary() create a dictionary to store a computed average PM2.5 value for each country from all cities and year records in the file air-quality.tsv In the function add cia-population data(...) retrieve the popluation for each country with a PM2.5 value from the file cia population.tsv. The population data may need to be cleaned up using strip to remove extra quotation marks. Assemble the country name, population and PM2.5 data into a second dictionary that contains the country name as a the key and the population and PM2.5 as a list of values Finally, sort the data in the function print exceed threshold by country names and print the country name, population and PM2.5 value. Only print out the countries that exceed the WHO's threshold shown and represented in our dataset in ug/m3) for PM2.5 levels that increase long-term mortality risk by 15% shown in Figure 1

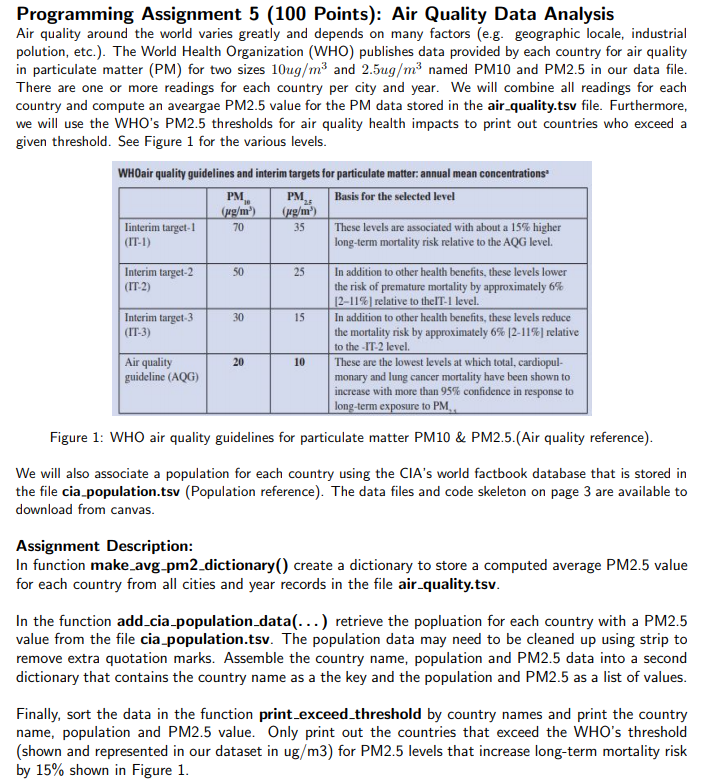
Step by Step Solution

There are 3 Steps involved in it

Step: 1

blur-text-image

Get Instant Access to Expert-Tailored Solutions

See step-by-step solutions with expert insights and AI powered tools for academic success

Step: 2

blur-text-image

Step: 3

blur-text-image

Ace Your Homework with AI

Get the answers you need in no time with our AI-driven, step-by-step assistance

Get Started

Recommended Textbook for

Data Access Patterns Database Interactions In Object Oriented Applications

Authors: Clifton Nock

1st Edition

0321555627, 978-0321555625

More Books

Students also viewed these Databases questions

Question

What is the difference between Needs and GAP Analyses?

Answered: 1 week ago

Question

What are ERP suites? Are HCMSs part of ERPs?

Answered: 1 week ago