

Question
Using python in spyder create a Confusion Matrix and find the Performance Accuracy # Random Forest import numpy as np # linear algebra import pandas
Using python in spyder create a Confusion Matrix and find the Performance Accuracy
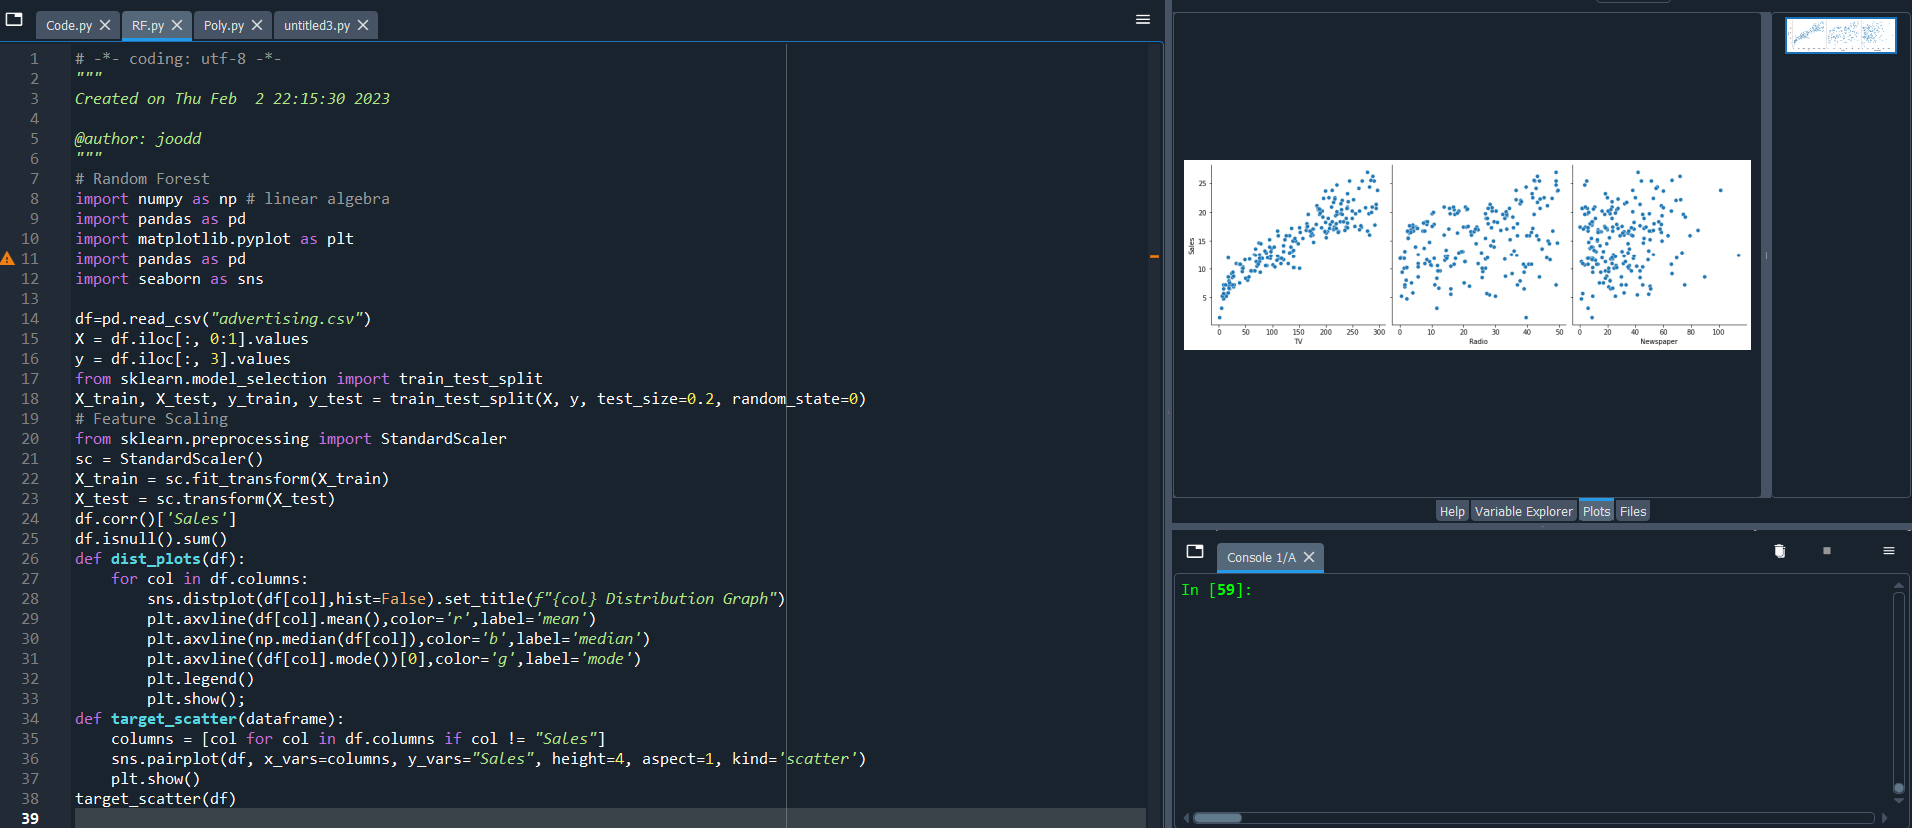
# Random Forest import numpy as np # linear algebra import pandas as pd import matplotlib.pyplot as plt import pandas as pd import seaborn as sns
df=pd.read_csv("advertising.csv") X = df.iloc[:, 0:1].values y = df.iloc[:, 3].values from sklearn.model_selection import train_test_split X_train, X_test, y_train, y_test = train_test_split(X, y, test_size=0.2, random_state=0) # Feature Scaling from sklearn.preprocessing import StandardScaler sc = StandardScaler() X_train = sc.fit_transform(X_train) X_test = sc.transform(X_test) df.corr()['Sales'] df.isnull().sum() def dist_plots(df): for col in df.columns: sns.distplot(df[col],hist=False).set_title(f"{col} Distribution Graph") plt.axvline(df[col].mean(),color='r',label='mean') plt.axvline(np.median(df[col]),color='b',label='median') plt.axvline((df[col].mode())[0],color='g',label='mode') plt.legend() plt.show(); def target_scatter(dataframe): columns = [col for col in df.columns if col != "Sales"] sns.pairplot(df, x_vars=columns, y_vars="Sales", height=4, aspect=1, kind='scatter') plt.show() target_scatter(df)
Step by Step Solution
There are 3 Steps involved in it
Step: 1

Get Instant Access to Expert-Tailored Solutions
See step-by-step solutions with expert insights and AI powered tools for academic success
Step: 2

Step: 3
Ace Your Homework with AI
Get the answers you need in no time with our AI-driven, step-by-step assistance
Get Started
Constraint Based Mining And Inductive Databases European Workshop On Inductive Databases And Constraint Based Mining Hinterzarten Germany March 2004 Revised Selected Papers Lnai 3848
Authors: Jean-Francois Boulicaut ,Luc De Raedt ,Heikki Mannila
2006th Edition
3540313311, 978-3540313311