Using PYTHON: In this project you will analyze data taken by students in a Modern Physics lab using the Thomson apparatus in order to measure the charge-to-mass ratio of the electron. In the experiment a beam of electrons moves in a circle in a magnetic field created by Helmholtz coils. The radius of the circle r is measured as a function of accelerating voltage V and Helmholtz coil current I. The charge-to-mass ratio e/m for the electrons can be shown to be
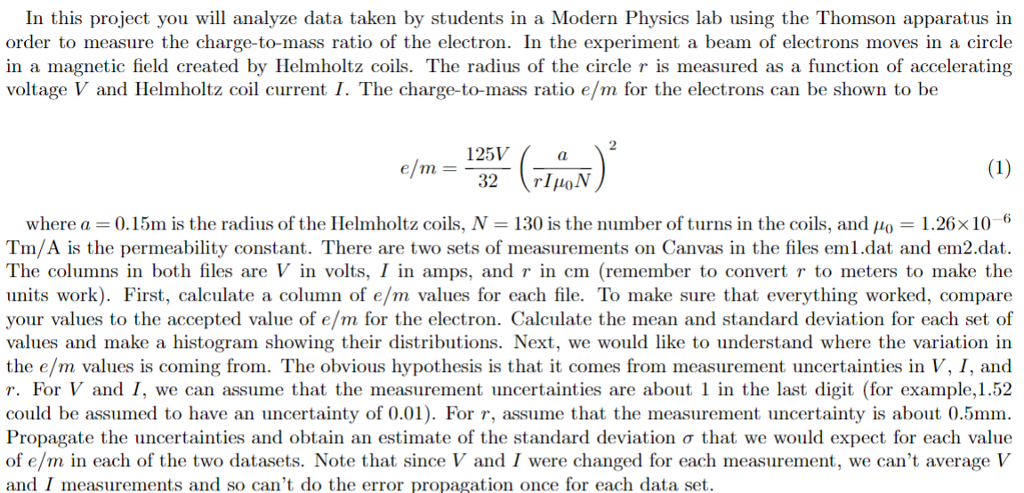
In this project you will analyze data taken by students in a Modern Physics lab using the Thomson apparatus in order to measure the charge-to-mass ratio of the electron. In the experiment a beam of electrons moves in a circle in a magnetic field created by Helmholtz coils. The radius of the circle r is measured as a function of accelerating voltage V and Helmholtz coil current I. The charge-to-mass ratio e/m for the electrons can be shown to be 125V where a-0. 15m is the radius of the Helmholtz coils. N-130 is the number of turns in the coils, and ,40 1.26 10 6 Tm/A is the permeability constant. There are two sets of measurements on Canvas in the files em1.dat and em2.dat. The columns in both files are V in volts, I in amps, and r in cm (remember to convert r to meters to make the units work). First, calculate a column of e/m values for each file. To make sure that everything worked, compare your values to the accepted value of e/m for the electron. Calculate the mean and standard deviation for each set of values and make a histogram showing their distributions. Next, we would like to understand where the variation in the e/m values is coming from. The obvious hypothesis is that it comes from measurement uncertainties in V, I, and r. For V and I, we can assume that the measurement uncertainties are about 1 in the last digit (for example,1.52 could be assumed to have an uncertainty of 0.01). For r, assume that the measurement uncertainty is about 0.5mnm Propagate the uncertainties and obtain an estimate of the standard deviation that we would expect for each value of e/m in each of the two datasets. Note that since V and I were changed for each measurement, we can't average V and I measurements and so can't do the error propagation once for each data set. In this project you will analyze data taken by students in a Modern Physics lab using the Thomson apparatus in order to measure the charge-to-mass ratio of the electron. In the experiment a beam of electrons moves in a circle in a magnetic field created by Helmholtz coils. The radius of the circle r is measured as a function of accelerating voltage V and Helmholtz coil current I. The charge-to-mass ratio e/m for the electrons can be shown to be 125V where a-0. 15m is the radius of the Helmholtz coils. N-130 is the number of turns in the coils, and ,40 1.26 10 6 Tm/A is the permeability constant. There are two sets of measurements on Canvas in the files em1.dat and em2.dat. The columns in both files are V in volts, I in amps, and r in cm (remember to convert r to meters to make the units work). First, calculate a column of e/m values for each file. To make sure that everything worked, compare your values to the accepted value of e/m for the electron. Calculate the mean and standard deviation for each set of values and make a histogram showing their distributions. Next, we would like to understand where the variation in the e/m values is coming from. The obvious hypothesis is that it comes from measurement uncertainties in V, I, and r. For V and I, we can assume that the measurement uncertainties are about 1 in the last digit (for example,1.52 could be assumed to have an uncertainty of 0.01). For r, assume that the measurement uncertainty is about 0.5mnm Propagate the uncertainties and obtain an estimate of the standard deviation that we would expect for each value of e/m in each of the two datasets. Note that since V and I were changed for each measurement, we can't average V and I measurements and so can't do the error propagation once for each data set