Answered step by step
Verified Expert Solution
Link Copied!

Question

1 Approved Answer

Using Python to do this work: For your solution please include screenshots like i did for better understanding. These are instructions: TWITTER AIRLINE SENTIMENT ANALYSIS

Using Python to do this work: For your solution please include screenshots like i did for better understanding.

These are instructions:

TWITTER AIRLINE SENTIMENT ANALYSIS In class, we studied the nave Bayes algorithms and its application to text classification. We also had a lab on this topic. In this assignment, you will apply the NB classifier to the Twitter US Airline Sentiment dataset, which is available at: https://www.kaggle.com/crowdflower/twitter-airline-sentiment/version/2 You will work with the file Tweets.csv and primarily be concerned with three columns: - airline_sentiment - airline - text You have to write a Python script to perform the following tasks: 1. Your program should have one argument that reads in the location of the Tweets.csv file from your computer. If you are not familiar with this, you can read more about it here: https://www.pythonforbeginners.com/system/python-sys-argv 2. Read the above 3 columns into a dataframe 3. Perform the following text pre-processing steps: - convert text to lowercase - transform the text data using CountVectorizer and TfidfTransformer, just like we did in the lab. - convert the airline_sentiment from categorical to numerical values. You can use the LabelEncoder class in sklearn to do this: http://scikit-learn.org/stable/modules/generated/sklearn.preprocessing.LabelEncoder.html 4. Now split the data into two parts: training and testing. 10% of the data should go to the test part. You can use the train_test_split method in scikit learn to accomplish this. 5. Build a Multinomial Nave Bayes (MNB) model using the training dataset. You have to choose the best set of parameters. 6. Apply your model on the test part and output the accuracy. 7. Repeat this process 5 times with different parameter choices and output the parameters and accuracy in a tabular format. 8. The following is not related to nave Bayes, but you can use the above data to answer the following question: Using the numeric value of airline_sentiment, output the average sentiment of each airline and report which airline has the highest positive sentiment.

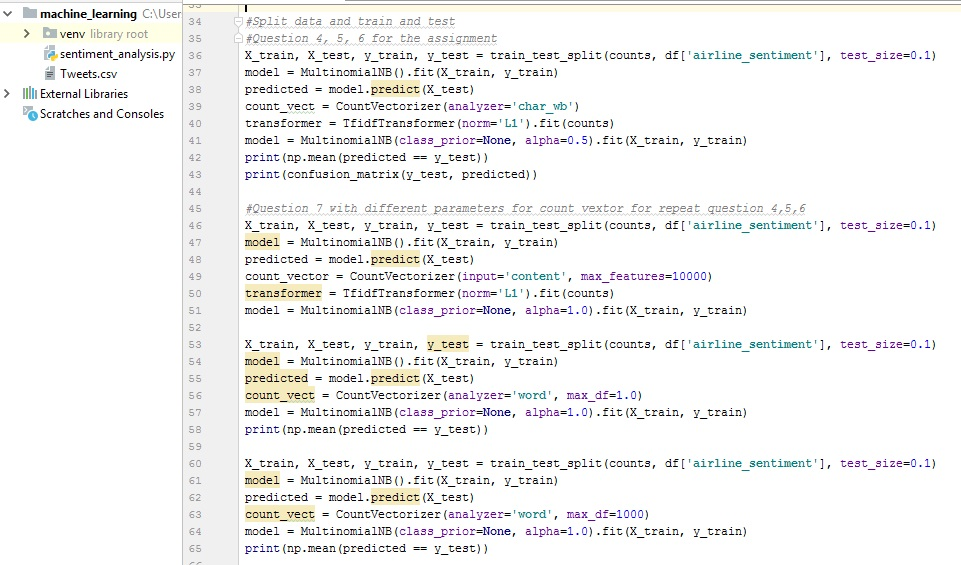
This is my work: MY CODE: -It is not printing the middle column of airlines in the result. Why is it not printing the airline column? Please help me fix this. -Question 7 is printing the same value for all the parameters. Please fix it. Also how can I increase accuracy for Multinomial BN.
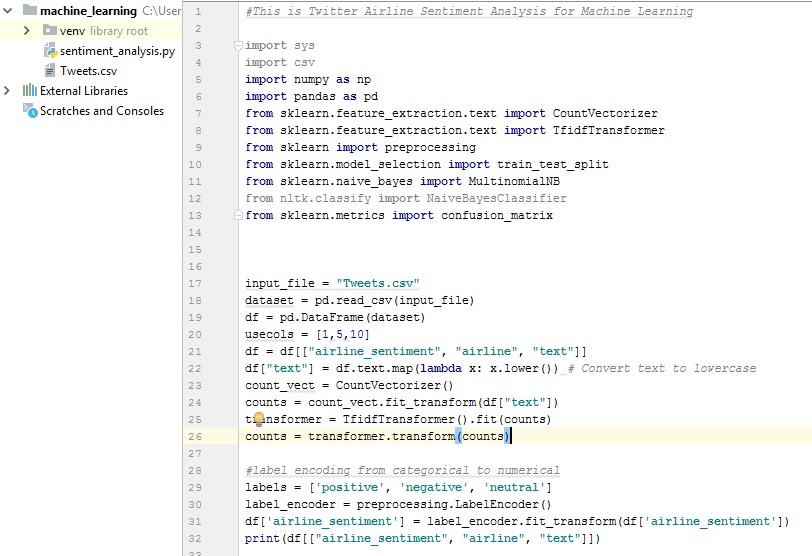
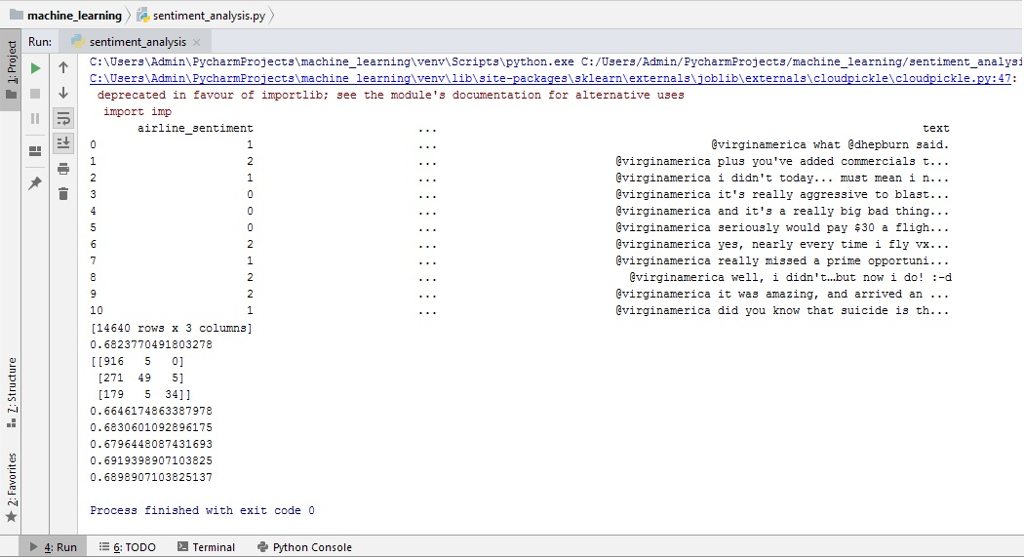
image text in transcribed

image text in transcribedimage text in transcribed

machine_learning CAUser 1 #This is Titter Airline Sentiment Analysis for Machine Learning veny library root import sys sentiment_ analysis.py import csv import numpy as np import pandas as pd from sklearn.feature_extraction.text import CountVectorizer from sklearn.feature_extraction.text import TfidfTransformer from sklearn import from sklearn.model_selection import train test_split from sklearn.naive_bayes import MultinomialNB from nltk.classify import NaiveBayesClassifier from sklearn.metrics import confusion matrix IllI External Libraries scratches and Consoles preprocessing 10 12 13 15 16 17 18 19 20 21 input_file "Tweets.cSv" dataset pd. read-csv (input-file) df - pd.DataFrame (dataset) usecols = [1,5,10] df=df [["airline sentiment", "airline", "text"]] df ["text"] df. text .map (1ambda x: x. lower()) # Convert count_vectCountvectorizer () counts- count_vect.fit_transform(df ["text"]) text to lowercase 23 2 4 25 t nsformerTfidfTransformer ().fit (counts) 26 27 28 29 30 31 counts - transformer.transform (counts) transorm(counts)l #label encoding from categorical to numerical labels['positive', 'negative, neutral'] label-encoder = preprocessing. Labe!Encoder() df['airline_sentiment'] - label_encoder.fit_transform(df['airline_sentiment']) print (df[["airline_sentiment", "airline, "text"]]) machine_learning CAUser 1 #This is Titter Airline Sentiment Analysis for Machine Learning veny library root import sys sentiment_ analysis.py import csv import numpy as np import pandas as pd from sklearn.feature_extraction.text import CountVectorizer from sklearn.feature_extraction.text import TfidfTransformer from sklearn import from sklearn.model_selection import train test_split from sklearn.naive_bayes import MultinomialNB from nltk.classify import NaiveBayesClassifier from sklearn.metrics import confusion matrix IllI External Libraries scratches and Consoles preprocessing 10 12 13 15 16 17 18 19 20 21 input_file "Tweets.cSv" dataset pd. read-csv (input-file) df - pd.DataFrame (dataset) usecols = [1,5,10] df=df [["airline sentiment", "airline", "text"]] df ["text"] df. text .map (1ambda x: x. lower()) # Convert count_vectCountvectorizer () counts- count_vect.fit_transform(df ["text"]) text to lowercase 23 2 4 25 t nsformerTfidfTransformer ().fit (counts) 26 27 28 29 30 31 counts - transformer.transform (counts) transorm(counts)l #label encoding from categorical to numerical labels['positive', 'negative, neutral'] label-encoder = preprocessing. Labe!Encoder() df['airline_sentiment'] - label_encoder.fit_transform(df['airline_sentiment']) print (df[["airline_sentiment", "airline, "text"]])

Step by Step Solution

There are 3 Steps involved in it

Step: 1

blur-text-image

Get Instant Access to Expert-Tailored Solutions

See step-by-step solutions with expert insights and AI powered tools for academic success

Step: 2

blur-text-image

Step: 3

blur-text-image

Ace Your Homework with AI

Get the answers you need in no time with our AI-driven, step-by-step assistance

Get Started

Students also viewed these Databases questions

Question

3. Would you say that effective teamwork saved their lives?

Answered: 1 week ago