

Question
Using python to improve this bad line chart by following the steps: Now we need to plot the data over different panels. We can use
Using python to improve this bad line chart by following the steps:
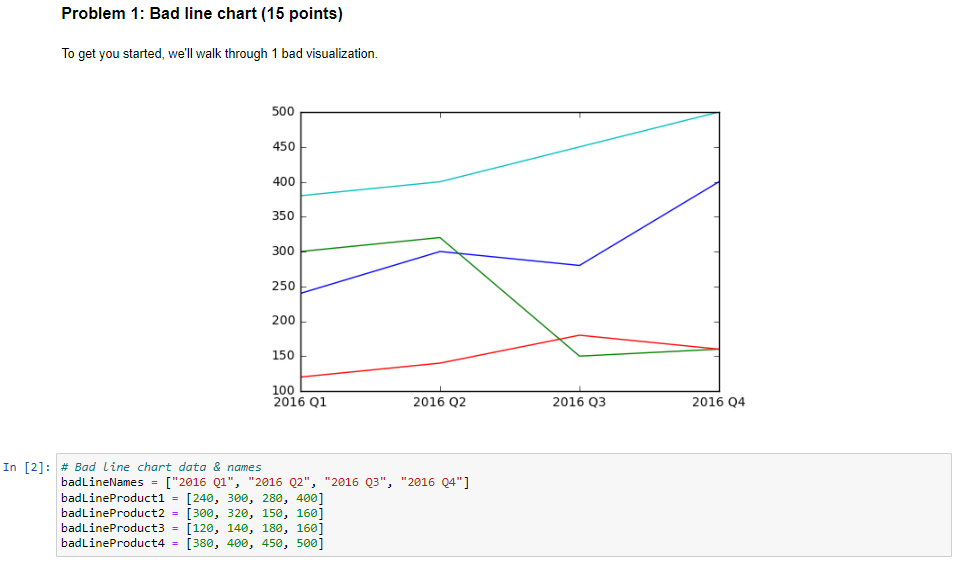
Now we need to plot the data over different panels. We can use plt.subplots to create multiple panels. Since we have 4 products, we're going to need 4 panels on top of each other. subplots returns two variables, the figure object and an array of axes. What we can do is loop through each Axes object and create a plot for that product. The first Axes object should plot the first product, the second should plot the second product and so on. Step 1: Buffers Each subplot will have its own y axis, but to make the scale is the same for all subplots, create a buffer between the lowest value among all products and the start of the y axis as well as between the highest value and the top of the y axis. These buffers are simply integers that extend the y axis above the highest value in the products, and below the lowest. Step 2: Mean Calculate the mean of the entire data set -- the mean of the individual product means. To calculate this easily, first put the products in a list, create a list of the individual means using a comprehension over the product list, then find the mean of the list of individual means. Step 3: Colors Choose a color for the plot of each product. This can be done by filling a list with each color's matplotlib name. Available colors can be found here Step 4: Subplots Now that those numbers are calculated, create 4 line charts on top of each other, each plotting one of the products. For each subplot:
1) plot the product with plot(data, color) 2) Set the y scale using set_ylim(bottomBuffer, topBuffer) 3) Add an x label if this panel is not the bottom one using set_xticklabels(list of labels) 4) Add a title to the subplot with the product number using set_title(title) 5) Add a dashed line with the value of the mean using plot(mean, args) or axhline(mean, args). More info here Step 5: Beautify
1) Add a title to the whole diagram(the superplot) with fig.suptitle(title) 2) Rearrange subplots, if necessary, with fig.subplots_adjust(left, bottom, right, top, wspace, hspace) Notes:
- Many of the arguments to many of these functions are 'default', meaning they're optional. If there's an argument you don't need or want, try leaving it out. For example, if you only want to change the hspace of the subplots, you can call fig.subplot_adjust(hspace=0.6) without specifying the other arguments. Just be sure to label the argument you want to specify. Don't just write fig.subplot_adjust(0.6)
Step by Step Solution
There are 3 Steps involved in it
Step: 1

Get Instant Access to Expert-Tailored Solutions
See step-by-step solutions with expert insights and AI powered tools for academic success
Step: 2

Step: 3
Ace Your Homework with AI
Get the answers you need in no time with our AI-driven, step-by-step assistance
Get Started
Structured Search For Big Data From Keywords To Key-objects
Authors: Mikhail Gilula
1st Edition
012804652X, 9780128046524