Answered step by step
Verified Expert Solution
Link Copied!

Question

1 Approved Answer

USING PYTHON Write a function to get the statistics of quarter sales. This function accepts a list, by iterating this list, this function can return

USING PYTHONimage text in transcribed

Write a function to get the statistics of quarter sales. This function accepts a list, by iterating this list, this function can return a dictionary. For example, the sales are 100, 50, 70, 105, 90, 59, 78, 200, 130, 180, 60, 105 million from January to December respectively, so by passing the list of [100, 50, 70, 105, 90, 59, 78, 200, 130, 180, 60, 105] to this function, we can get a dictionary of {'First quarter': 220, 'Second quarter': 254, 'Third quarter': 408, 'Fourth quarter': 345). Then based on this dictionary to draw a Pie chart to visualize them and focus on the quarter with highest sales using Matplotlib.

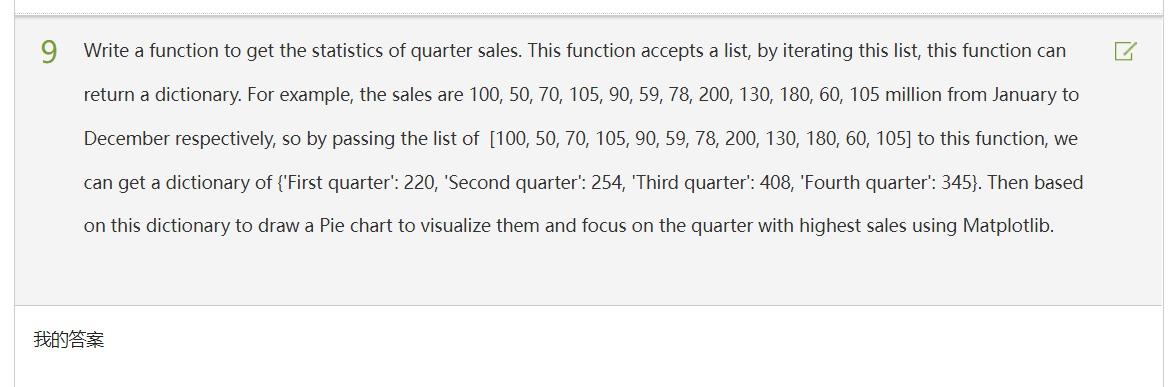
Step by Step Solution

There are 3 Steps involved in it

Step: 1

blur-text-image

Get Instant Access to Expert-Tailored Solutions

See step-by-step solutions with expert insights and AI powered tools for academic success

Step: 2

blur-text-image

Step: 3

blur-text-image

Ace Your Homework with AI

Get the answers you need in no time with our AI-driven, step-by-step assistance

Get Started

Recommended Textbook for

Concepts of Database Management

Authors: Philip J. Pratt, Mary Z. Last

8th edition

1285427106, 978-1285427102

More Books

Students also viewed these Databases questions

Question

What is focal length? Explain with a diagram and give an example.

Answered: 1 week ago

Question

What is physics and how does it apply in daily life?

Answered: 1 week ago

Question

What is our budget?

Answered: 1 week ago