Answered step by step
Verified Expert Solution
Link Copied!

Question

1 Approved Answer

Using R program: Read and try out the list of comments and examples in Appendix A: A Sample Session in the An Introduction to R

Using R program:
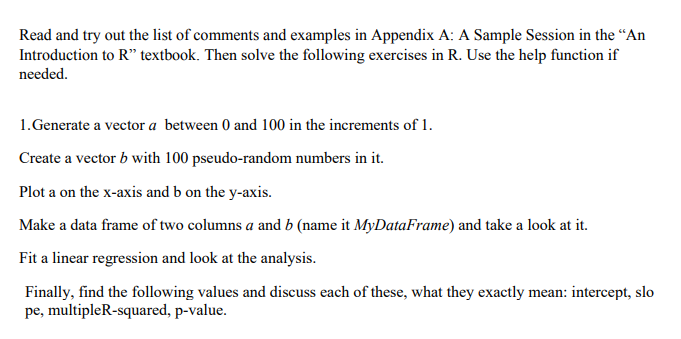
image text in transcribed

Read and try out the list of comments and examples in Appendix A: A Sample Session in the "An Introduction to R" textbook. Then solve the following exercises in R. Use the help function if needed in the increments of 1.Generate a vector a between 0 and 100 Create a vector b with 100 pseudo-random numbers in it Plot a on the x-axis and b on the y-axis. Make a data frame of two columns a and b (name it MyDataFrame) and take a look at it. Fit a linear regression and look at the analysis. Finally, find the following values and discuss each of these, what they exactly mean: intercept, slo pe, multipleR-squared, p-value

Step by Step Solution

There are 3 Steps involved in it

Step: 1

blur-text-image

Get Instant Access to Expert-Tailored Solutions

See step-by-step solutions with expert insights and AI powered tools for academic success

Step: 2

blur-text-image_2

Step: 3

blur-text-image_3

Ace Your Homework with AI

Get the answers you need in no time with our AI-driven, step-by-step assistance

Get Started

Recommended Textbook for

Murach's SQL Server 2012 For Developers

Authors: Bryan Syverson, Joel Murach, Mike Murach

1st Edition

1890774693, 9781890774691

More Books

Students also viewed these Databases questions

Question

What do Dimensions represent in OLAP Cubes?

Answered: 1 week ago