Answered step by step
Verified Expert Solution
Question
1 Approved Answer
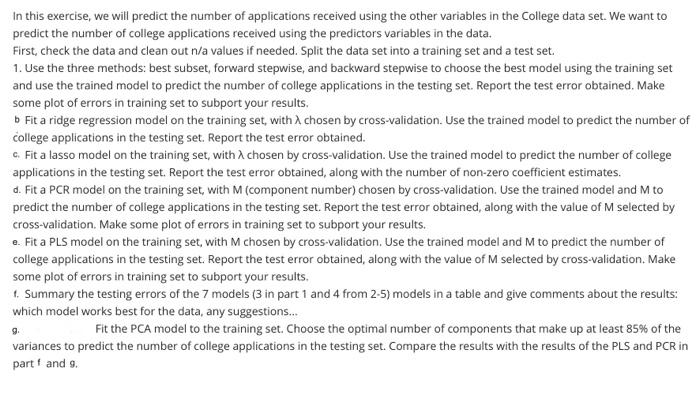
Using R studio and the College data set from ISLR2 library answer the following questions: In this exercise, we will predict the number of applications

Using R studio and the College data set from ISLR2 library answer the following questions:
In this exercise, we will predict the number of applications received using the other variables in the College data set. We want to predict the number of college applications received using the predictors variables in the data. First, check the data and clean out n/ a values if needed. Split the data set into a training set and a test set. 1. Use the three methods: best subset, forward stepwise, and backward stepwise to choose the best model using the training set and use the trained model to predict the number of college applications in the testing set. Report the test error obtained. Make some plot of errors in training set to subport your results. b Fit a ridge regression model on the training set, with chosen by cross-validation. Use the trained model to predict the number of college applications in the testing set. Report the test error obtained. c. Fit a lasso model on the training set, with chosen by cross-validation. Use the trained model to predict the number of college applications in the testing set. Report the test error obtained, along with the number of non-zero coefficient estimates. d. Fit a PCR model on the training set, with M (component number) chosen by cross-validation. Use the trained model and M to predict the number of college applications in the testing set. Report the test error obtained, along with the value of M selected by cross-validation. Make some plot of errors in training set to subport your results. e. Fit a PLS model on the training set, with M chosen by cross-validation. Use the trained model and M to predict the number of college applications in the testing set. Report the test error obtained, along with the value of M selected by cross-validation. Make some plot of errors in training set to subport your results. 1. Summary the testing errors of the 7 models ( 3 in part 1 and 4 from 2-5) models in a table and give comments about the results: which model works best for the data, any suggestions... g. Fit the PCA model to the training set. Choose the optimal number of components that make up at least 85% of the variances to predict the number of college applications in the testing set. Compare the results with the results of the PLS and PCR in part f and 9 Step by Step Solution
There are 3 Steps involved in it
Step: 1

Get Instant Access to Expert-Tailored Solutions
See step-by-step solutions with expert insights and AI powered tools for academic success
Step: 2

Step: 3

Ace Your Homework with AI
Get the answers you need in no time with our AI-driven, step-by-step assistance
Get Started


