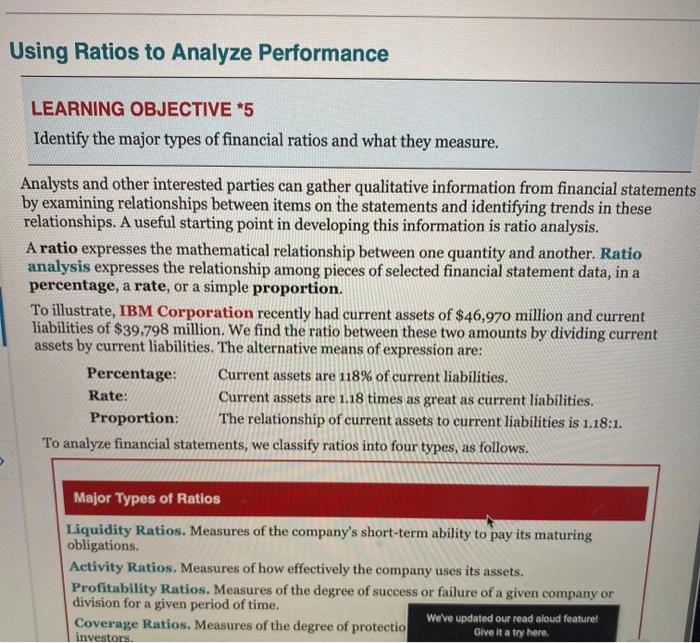
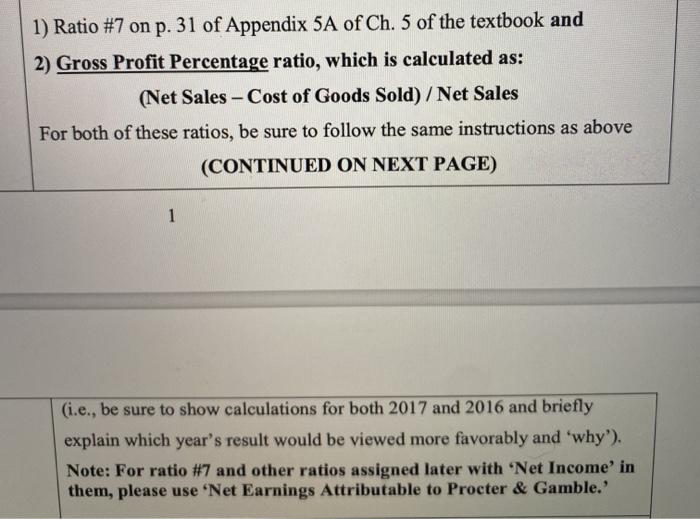
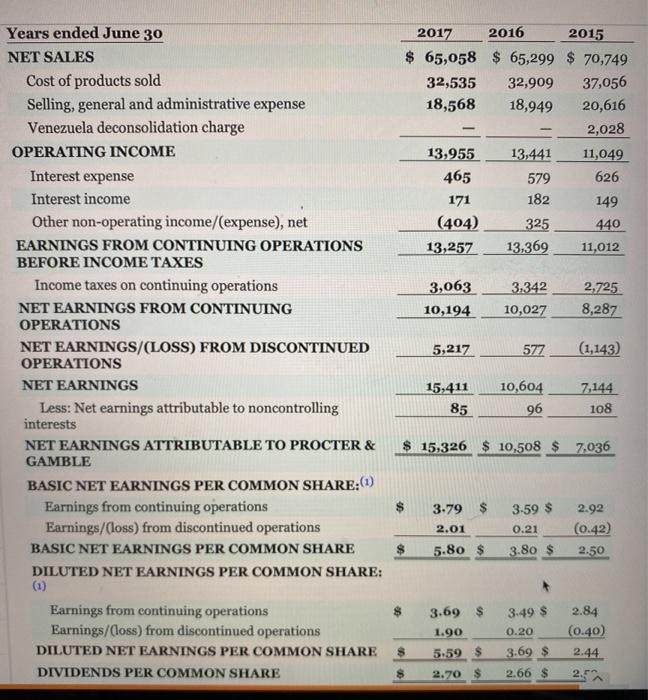
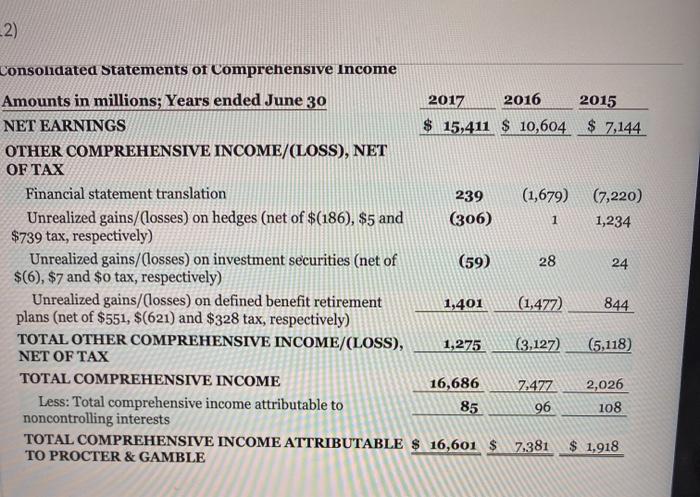
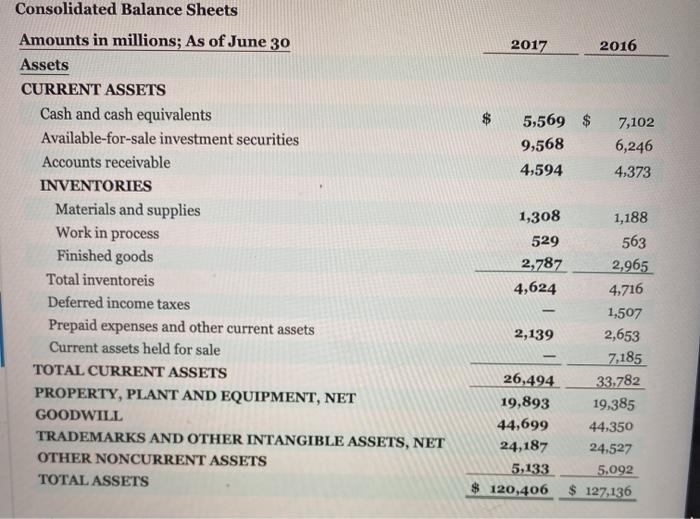
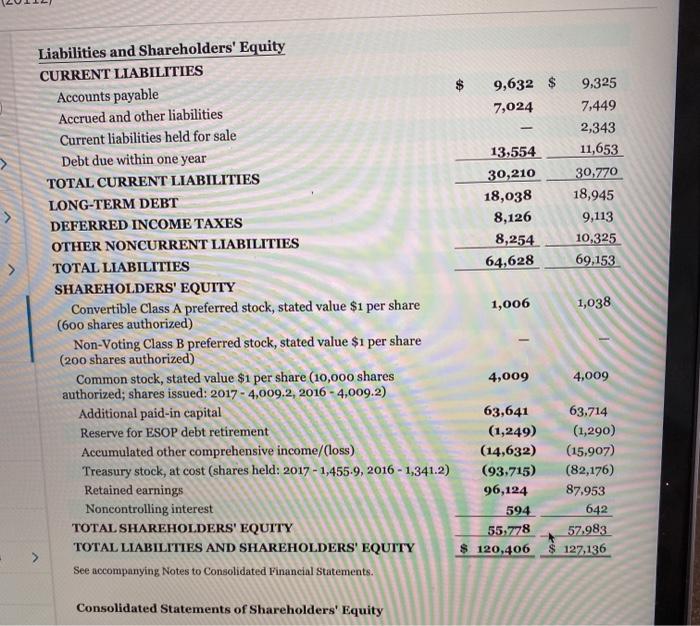
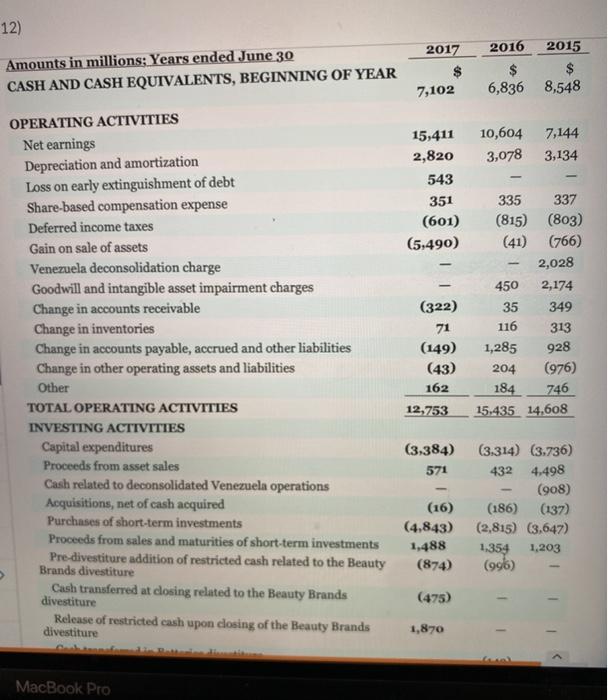
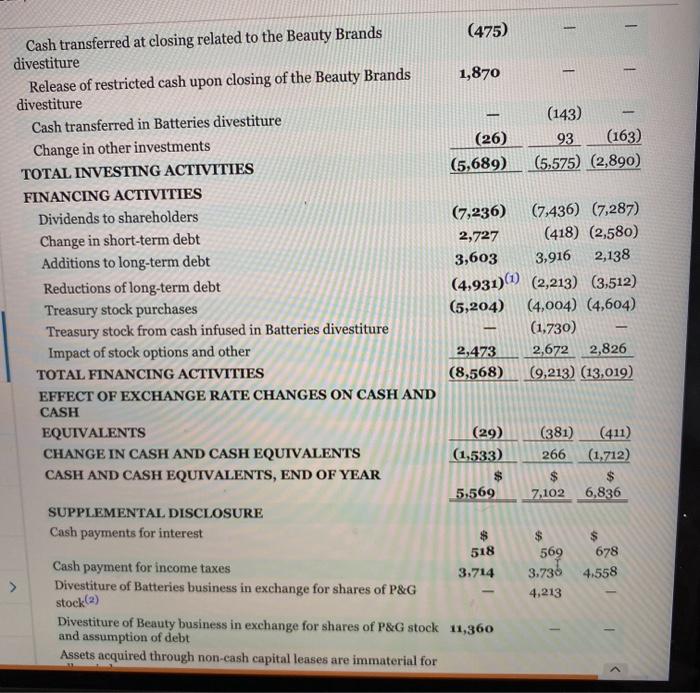
Using Ratios to Analyze Performance LEARNING OBJECTIVE *5 Identify the major types of financial ratios and what they measure. Analysts and other interested parties can gather qualitative information from financial statements by examining relationships between items on the statements and identifying trends in these relationships. A useful starting point in developing this information is ratio analysis. A ratio expresses the mathematical relationship between one quantity and another. Ratio analysis expresses the relationship among pieces of selected financial statement data, in a percentage, a rate, or a simple proportion. To illustrate, IBM Corporation recently had current assets of $46,970 million and current liabilities of $39.798 million. We find the ratio between these two amounts by dividing current assets by current liabilities. The alternative means of expression are: Percentage: Current assets are 118% of current liabilities. Rate: Current assets are 1.18 times as great as current liabilities. Proportion: The relationship of current assets to current liabilities is 1.18:1. To analyze financial statements, we classify ratios into four types, as follows. Major Types of Ratios Liquidity Ratios. Measures of the company's short-term ability to pay its maturing obligations. Activity Ratios. Measures of how effectively the company uses its assets. Profitability Ratios. Measures of the degree of success or failure of a given company or division for a given period of time. We've updated our read aloud featurel Coverage Ratios, Measures of the degree of protectio Give it a try here investors 1) Ratio #7 on p. 31 of Appendix 5A of Ch. 5 of the textbook and 2) Gross Profit Percentage ratio, which is calculated as: (Net Sales - Cost of Goods Sold) /Net Sales For both of these ratios, be sure to follow the same instructions as above (CONTINUED ON NEXT PAGE) 1 (i.e., be sure to show calculations for both 2017 and 2016 and briefly explain which year's result would be viewed more favorably and 'why'). Note: For ratio #7 and other ratios assigned later with 'Net Income' in them, please use 'Net Earnings Attributable to Procter & Gamble.' 2017 2016 2015 $ 65,058 $ 65,299 $ 70,749 32,535 32,909 37,056 18,568 18,949 20,616 2,028 13,955 13,441 11,049 465 579 626 171 182 149 (404) 325 440 13,257 13,369 11,012 3,063 10,194 3.342 10,027 2.725 8,287 Years ended June 30 NET SALES Cost of products sold Selling, general and administrative expense Venezuela deconsolidation charge OPERATING INCOME Interest expense Interest income Other non-operating income/(expense), net EARNINGS FROM CONTINUING OPERATIONS BEFORE INCOME TAXES Income taxes on continuing operations NET EARNINGS FROM CONTINUING OPERATIONS NET EARNINGS/(LOSS) FROM DISCONTINUED OPERATIONS NET EARNINGS Less: Net earnings attributable to noncontrolling interests NET EARNINGS ATTRIBUTABLE TO PROCTER & GAMBLE BASIC NET EARNINGS PER COMMON SHARE:(1) Earnings from continuing operations Earnings/(loss) from discontinued operations BASIC NET EARNINGS PER COMMON SHARE DILUTED NET EARNINGS PER COMMON SHARE: (1) Earnings from continuing operations Earnings/Closs) from discontinued operations DILUTED NET EARNINGS PER COMMON SHARE DIVIDENDS PER COMMON SHARE 5,217 577 (1,143) 7,144 15,411 85 10,604 96 108 $ 15,326 $ 10,508 $ 7,036 3.79 $ 3-59 2.01 0.21 2.92 (0.42) 2.50 $ 5.80 $ 3.80 $ 2.84 (0.40) 3.69 $ 1.90 5.59 $ 2.70 $ 3.49 $ 0.20 3.69 $ 2.66 $ $ 2.44 2) 1 Consolidated Statements of Comprehensive Income Amounts in millions; Years ended June 30 2017 2016 2015 NET EARNINGS $ 15,411 $ 10,604 $ 7,144 OTHER COMPREHENSIVE INCOME/(LOSS), NET OF TAX Financial statement translation 239 (1,679) (7,220) Unrealized gains/(losses) on hedges (net of $(186), $5 and (306) 1,234 $739 tax, respectively) Unrealized gains/(losses) on investment securities (net of (59) 28 24 $(6), $7 and $o tax, respectively) Unrealized gains/(losses) on defined benefit retirement 1,401 (1,477) plans (net of $551, $(621) and $328 tax, respectively) TOTAL OTHER COMPREHENSIVE INCOME/(LOSS), 1,275 (3,127) (5,118) NET OF TAX TOTAL COMPREHENSIVE INCOME 16,686 7,477 2,026 Less: Total comprehensive income attributable to 85 96 108 noncontrolling interests TOTAL COMPREHENSIVE INCOME ATTRIBUTABLE $ 16,601 $ 7.381 $ 1,918 TO PROCTER & GAMBLE 844 2017 2016 5,569 $ 9,568 4,594 7,102 6,246 4,373 Consolidated Balance Sheets Amounts in millions; As of June 30 Assets CURRENT ASSETS Cash and cash equivalents Available-for-sale investment securities Accounts receivable INVENTORIES Materials and supplies Work in process Finished goods Total inventoreis Deferred income taxes Prepaid expenses and other current assets Current assets held for sale TOTAL CURRENT ASSETS PROPERTY, PLANT AND EQUIPMENT, NET GOODWILL TRADEMARKS AND OTHER INTANGIBLE ASSETS, NET OTHER NONCURRENT ASSETS TOTAL ASSETS 1,308 1,188 529 563 2,787 2,965 4,624 4,716 1,507 2,139 2,653 7,185 26,494 33.782 19,893 19,385 44,699 44,350 24,187 24,527 5,133 5,092 $ 120,406 $ 127,136 9,632 $ 7,024 13,554 30,210 18,038 8,126 8,254 64,628 9,325 7.449 2,343 11,653 30,770 18,945 9,113 10.325 69,153 1,006 1,038 Liabilities and Shareholders' Equity CURRENT LIABILITIES Accounts payable Accrued and other liabilities Current liabilities held for sale Debt due within one year TOTAL CURRENT LIABILITIES LONG-TERM DEBT DEFERRED INCOME TAXES OTHER NONCURRENT LIABILITIES TOTAL LIABILITIES SHAREHOLDERS' EQUITY Convertible Class A preferred stock, stated value $1 per share (600 shares authorized) Non-Voting Class B preferred stock, stated value $1 per share (200 shares authorized) Common stock, stated value $1 per share (10,000 shares authorized; shares issued: 2017 - 4,009.2, 2016 - 4,009.2) Additional paid-in capital Reserve for ESOP debt retirement Accumulated other comprehensive income/loss) Treasury stock, at cost (shares held: 2017 - 1,455.9, 2016 - 1,341.2) Retained earnings Noncontrolling interest TOTAL SHAREHOLDERS' EQUITY TOTAL LIABILITIES AND SHAREHOLDERS' EQUITY See accompanying Notes to Consolidated Financial Statements. 4,009 4,009 63,641 (1,249) (14,632) (93.715) 96,124 594 55,778 $ 120,406 63,714 (1,290) (15.907) (82,176) 87,953 642 57.983 127,136 > Consolidated Statements of Shareholders' Equity 12) 2017 Amounts in millions: Years ended June 30 CASH AND CASH EQUIVALENTS, BEGINNING OF YEAR 2016 2015 $ 6,836 8,548 7,102 10,604 3,078 7,144 3,134 15,411 2,820 543 351 (601) (5,490) OPERATING ACTIVITIES Net earnings Depreciation and amortization Loss on early extinguishment of debt Share-based compensation expense Deferred income taxes Gain on sale of assets Venezuela deconsolidation charge Goodwill and intangible asset impairment charges Change in accounts receivable Change in inventories Change in accounts payable, accrued and other liabilities Change in other operating assets and liabilities Other TOTAL OPERATING ACTIVITIES INVESTING ACTIVITIES Capital expenditures Proceeds from asset sales Cash related to deconsolidated Venezuela operations Acquisitions, net of cash acquired Purchases of short-term investments Proceeds from sales and maturities of short-term investments Pre divestiture addition of restricted cash related to the Beauty Brands divestiture Cash transferred at closing related to the Beauty Brands divestiture Release of restricted cash upon closing of the Beauty Brands divestiture (322) 71 (149) (43) 162 335 337 (815) (803) (41) (766) 2,028 450 2,174 35 349 116 313 1,285 928 204 (976) 184 746 15,435 14,608 12,753 (3,384) 571 (16) (4,843) 1,488 (874) (3.314) (3,736) 432 4,498 (908) (186) (137) (2,815) (3,647) 1.354 1,203 (996) (475) 1,870 MacBook Pro (475) - 1 1,870 (26) (5,689) (143) 93 (163) (5,575) (2,890) Cash transferred at closing related to the Beauty Brands divestiture Release of restricted cash upon closing of the Beauty Brands divestiture Cash transferred in Batteries divestiture Change in other investments TOTAL INVESTING ACTIVITIES FINANCING ACTIVITIES Dividends to shareholders Change in short-term debt Additions to long-term debt Reductions of long-term debt Treasury stock purchases Treasury stock from cash infused in Batteries divestiture Impact of stock options and other TOTAL FINANCING ACTIVITIES EFFECT OF EXCHANGE RATE CHANGES ON CASH AND CASH EQUIVALENTS CHANGE IN CASH AND CASH EQUIVALENTS CASH AND CASH EQUIVALENTS, END OF YEAR (7,236) (7,436) (7,287) 2,727 (418) (2,580) 3,603 3,916 2,138 (4,931) (1) (2,213) (3,512) (5,204) (4,004) (4,604) (1,730) 2,473 2,672 2,826 (8,568) (9,213) (13,019) (29) (1,533) (381) (411) 266 (1.712) $ 7,102 6,836 5,569 SUPPLEMENTAL DISCLOSURE Cash payments for interest $ 518 569 $ 678 4.558 3.736 4,213 Cash payment for income taxes 3,714 Divestiture of Batteries business in exchange for shares of P&G stock(2) Divestiture of Beauty business in exchange for shares of P&G stock 11,360 and assumption of debt Assets acquired through non-cash capital leases are immaterial for