

Answered step by step
Verified Expert Solution
Question
1 Approved Answer
USING RSTUDIO beaver.txt: 36.33 36.34 36.35 36.42 36.55 36.69 36.71 36.75 36.81 36.88 36.89 36.91 36.85 36.89 36.89 36.67 36.5 36.74 36.77 36.76 36.78 36.82
USING RSTUDIO
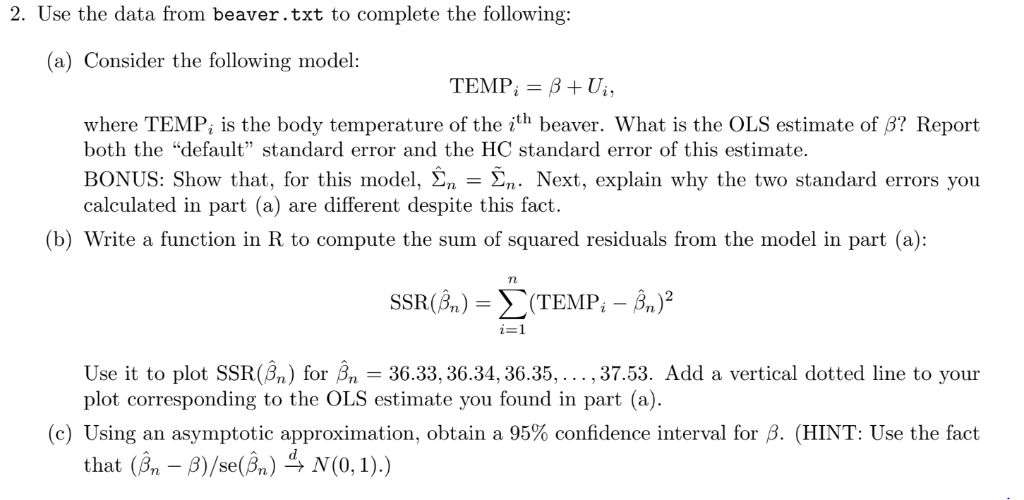
beaver.txt: 36.33 36.34 36.35 36.42 36.55 36.69 36.71 36.75 36.81 36.88 36.89 36.91 36.85 36.89 36.89 36.67 36.5 36.74 36.77 36.76 36.78 36.82 36.89 36.99 36.92 36.99 36.89 36.94 36.92 36.97 36.91 36.79 36.77 36.69 36.62 36.54 36.55 36.67 36.69 36.62 36.64 36.59 36.65 36.75 36.8 36.81 36.87 36.87 36.89 36.94 36.98 36.95 37 37.07 37.05 37 36.95 37 36.94 36.88 36.93 36.98 36.97 36.85 36.92 36.99 37.01 37.1 37.09 37.02 36.96 36.84 36.87 36.85 36.85 36.87 36.89 36.86 36.91 37.53 37.23 37.2 37.25 37.2 37.21 37.24 37.1 37.2 37.18 36.93 36.83 36.93 36.83 36.8 36.75 36.71 36.73 36.75 36.72 36.76 36.7 36.82 36.88 36.94 36.79 36.78 36.8 36.82 36.84 36.86 36.88 36.93 36.97 37.152. Use the data from beaver.txt to complete the following: (a) Consider the following model: where TEMP, is the body temperature of the ith beaver. What is the OLS estimate of B? Report both the "default" standard error and the HC standard error of this estimate. BONUS: Show that, for this model, -. Next, explain why the two standard errors you calculated in part (a) are different despite this fact b) Write a function in R to compute the sum of squared residuals from the model in part (a): SSR(%) -(TEMP,-%)2 Use it to plot SSR(Bn) for Bn 36.33,36.34,36.35,...,37.53. Add a vertical dotted line to your plot corresponding to the OLS estimate you found in part (a) (c) Using an asymptotic approximation, obtain a 95% confidence interval for . (HINT: Use the fact that (A,-)/se(%)-> N (0, 1) .) 2. Use the data from beaver.txt to complete the following: (a) Consider the following model: where TEMP, is the body temperature of the ith beaver. What is the OLS estimate of B? Report both the "default" standard error and the HC standard error of this estimate. BONUS: Show that, for this model, -. Next, explain why the two standard errors you calculated in part (a) are different despite this fact b) Write a function in R to compute the sum of squared residuals from the model in part (a): SSR(%) -(TEMP,-%)2 Use it to plot SSR(Bn) for Bn 36.33,36.34,36.35,...,37.53. Add a vertical dotted line to your plot corresponding to the OLS estimate you found in part (a) (c) Using an asymptotic approximation, obtain a 95% confidence interval for . (HINT: Use the fact that (A,-)/se(%)-> N (0, 1) .)
Step by Step Solution
There are 3 Steps involved in it
Step: 1

Get Instant Access to Expert-Tailored Solutions
See step-by-step solutions with expert insights and AI powered tools for academic success
Step: 2

Step: 3
Ace Your Homework with AI
Get the answers you need in no time with our AI-driven, step-by-step assistance
Get Started
Contemporary Issues In Database Design And Information Systems Development
Authors: Keng Siau
1st Edition
1599042894, 978-1599042893