

Question: Using R-Studio can I get help with all questions 1-5 Short Answer Question For Week 8 (Practice) The dataset below contains a subset of questions
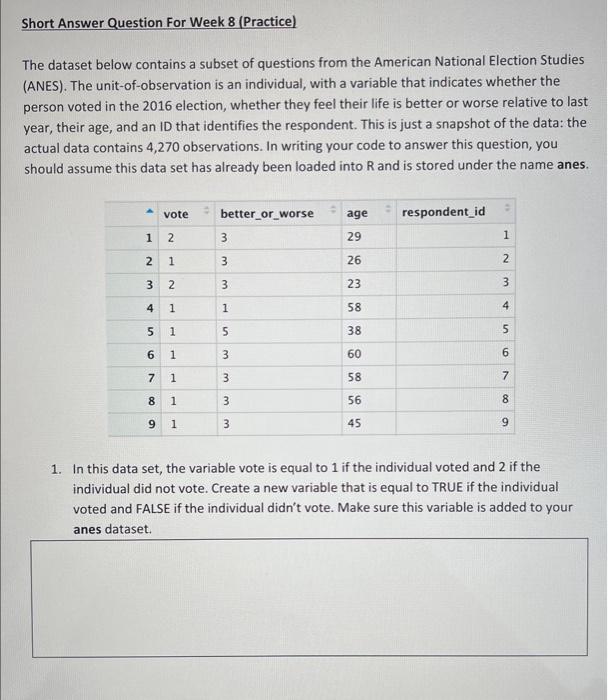
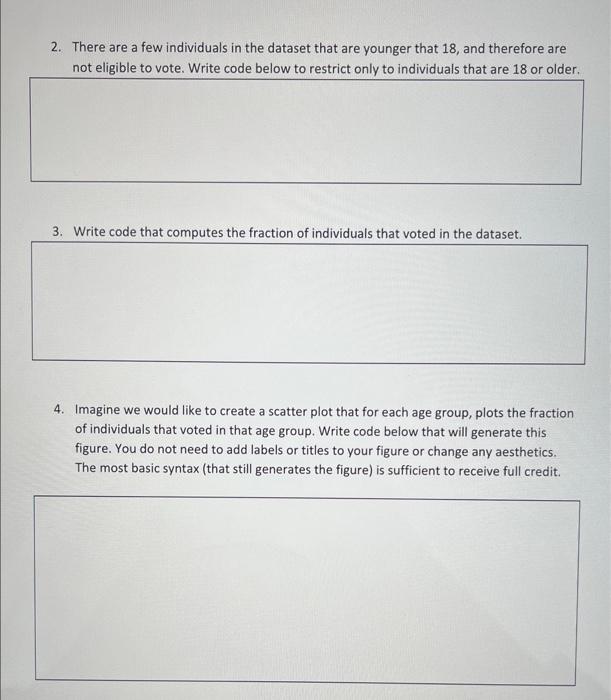
Short Answer Question For Week 8 (Practice) The dataset below contains a subset of questions from the American National Election Studies (ANES). The unit-of-observation is an individual, with a variable that indicates whether the person voted in the 2016 election, whether they feel their life is better or worse relative to last year, their age, and an ID that identifies the respondent. This is just a snapshot of the data: the actual data contains 4,270 observations. In writing your code to answer this question, you should assume this data set has already been loaded into R and is stored under the name anes. 1. In this data set, the variable vote is equal to 1 if the individual voted and 2 if the individual did not vote. Create a new variable that is equal to TRUE if the individual voted and FALSE if the individual didn't vote. Make sure this variable is added to your anes dataset. 2. There are a few individuals in the dataset that are younger that 18 , and therefore are not eligible to vote. Write code below to restrict only to individuals that are 18 or older. 3. Write code that computes the fraction of individuals that voted in the dataset. 4. Imagine we would like to create a scatter plot that for each age group, plots the fraction of individuals that voted in that age group. Write code below that will generate this figure. You do not need to add labels or titles to your figure or change any aesthetics. The most basic syntax (that still generates the figure) is sufficient to receive full credit. 5. Now we want to create a bar plot. On the x-axis we want two groups: voters and nonvoters. On the y-axis we want the total number of individuals in the group. Additionally, we want to fill in the color of the bars based on the variable: better_or_worse. You do not need to add labels or titles to your figure or change any aesthetics. The most basic syntax (that still generates the figure) is sufficient to receive full credit
Step by Step Solution
There are 3 Steps involved in it

Get step-by-step solutions from verified subject matter experts