Answered step by step
Verified Expert Solution
Question
1 Approved Answer
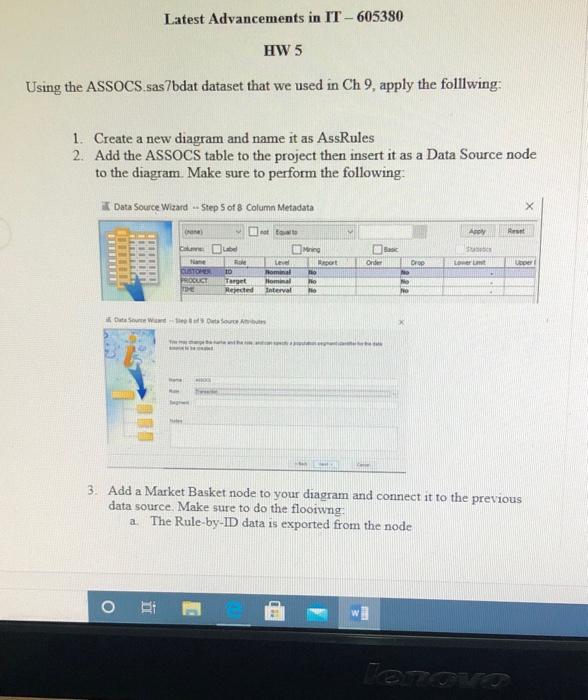
using sas studio Latest Advancements in IT - 605380 HW 5 Using the ASSOCS.sas 7bdat dataset that we used in Ch 9, apply the folllwing:


using sas studio
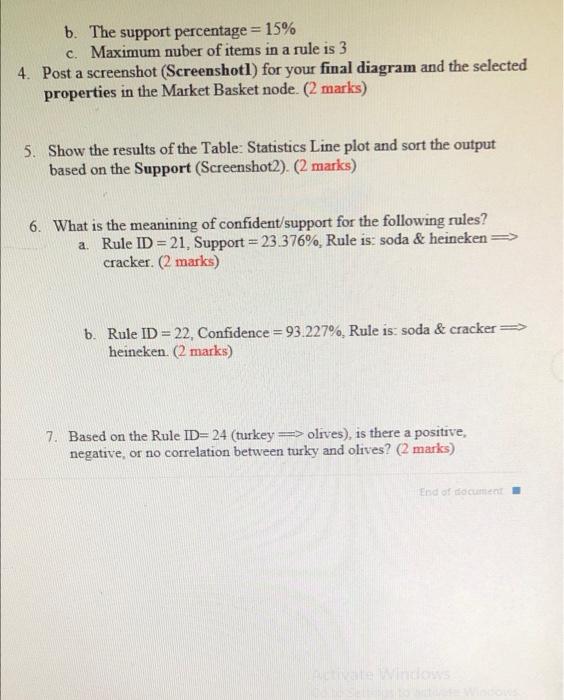
Latest Advancements in IT - 605380 HW 5 Using the ASSOCS.sas 7bdat dataset that we used in Ch 9, apply the folllwing: 1. Create a new diagram and name it as AssRules 2. Add the ASSOCS table to the project then insert it as a Data Source node to the diagram. Make sure to perform the following: at Data Source Wizard -- Step 5 of 8 Column Metadata Any Lab Order Drop Lorem Name CLSTORE FOLGT ID Target Rended Level Nominal Homme Interval port to mo HO 1222 Sve Window 3. Add a Market Basket node to your diagram and connect it to the previous data source. Make sure to do the flooiwng The Rule-by-ID data is exported from the node a Bi wi TOTO b. The support percentage = 15% C. Maximum nuber of items in a rule is 3 4. Post a screenshot (Screenshotl) for your final diagram and the selected properties in the Market Basket node. (2 marks) 5. Show the results of the Table: Statistics Line plot and sort the output based on the Support (Screenshot2). (2 marks) 6. What is the meanining of confident/support for the following rules? a. Rule ID = 21. Support = 23.376%, Rule is: soda & heineken => cracker. (2 marks) b. Rule ID = 22, Confidence = 93.227%, Rule is: soda & cracker => heineken. (2 marks) 7. Based on the Rule ID=24 (turkey => olives), is there a positive, negative, or no correlation between turky and olives? (2 marks) End of document Step by Step Solution
There are 3 Steps involved in it
Step: 1

Get Instant Access to Expert-Tailored Solutions
See step-by-step solutions with expert insights and AI powered tools for academic success
Step: 2

Step: 3

Ace Your Homework with AI
Get the answers you need in no time with our AI-driven, step-by-step assistance
Get Started


