Answered step by step
Verified Expert Solution
Question
1 Approved Answer
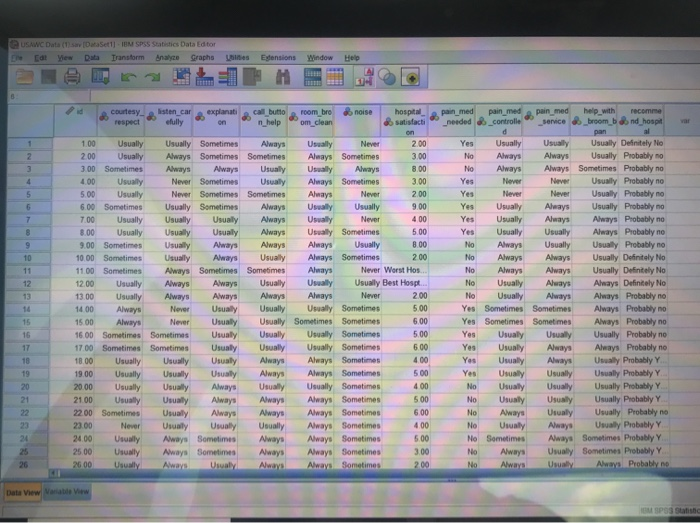
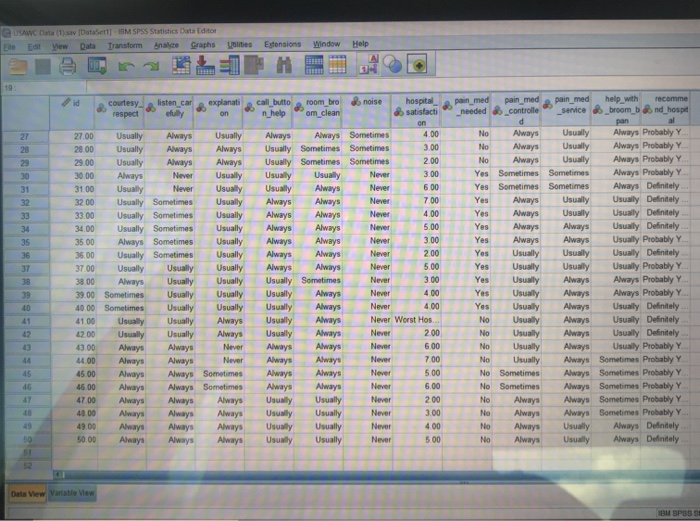
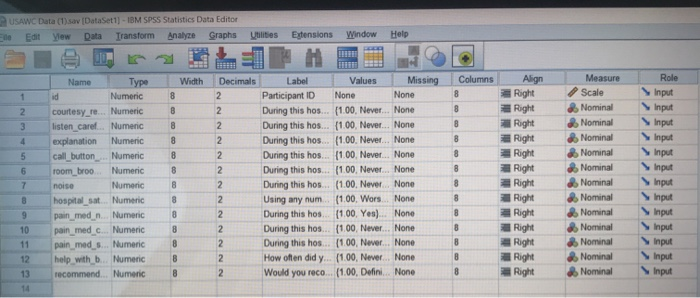
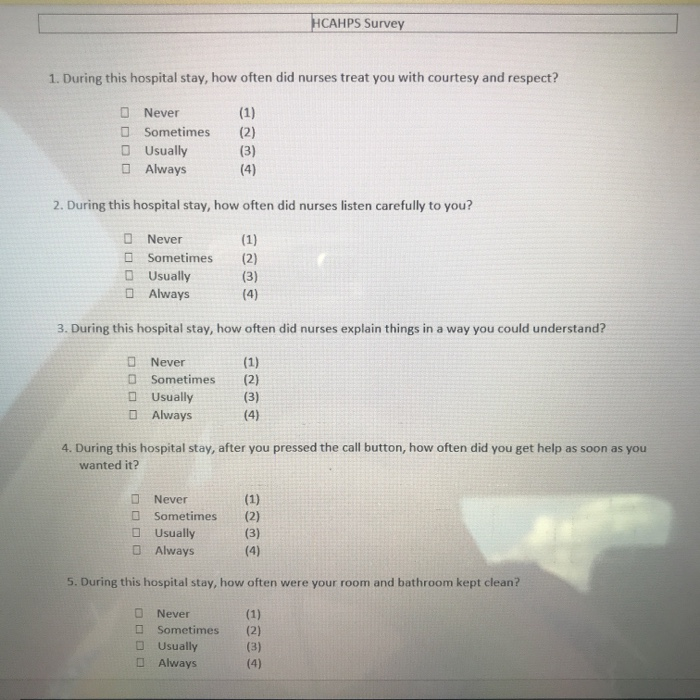
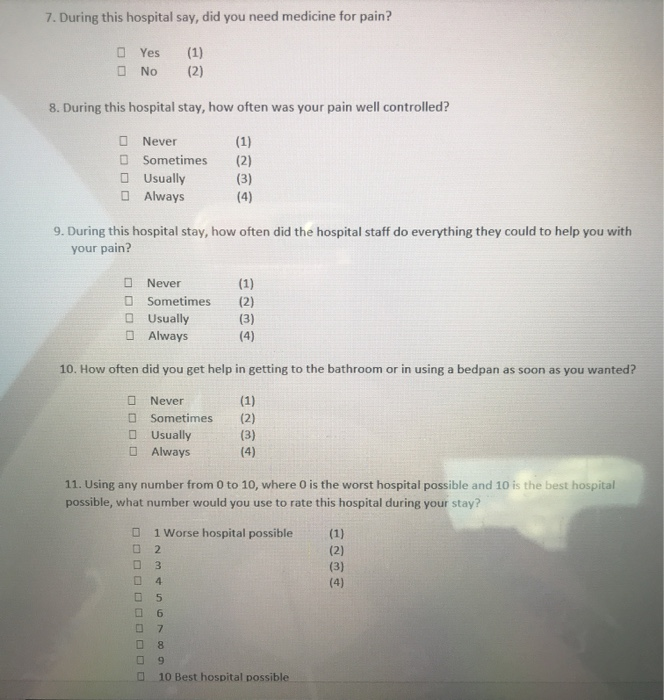
Using standard Grad pack version 25 SPSS The question is the image with a #1. What are the steps to complete the descriptive output pertinent


Using standard Grad pack version 25 SPSS
The question is the image with a #1. What are the steps to complete the descriptive output pertinent to noise levels in the hospital? The steps to complete the descriptive output as well as the desriptive output is needed.
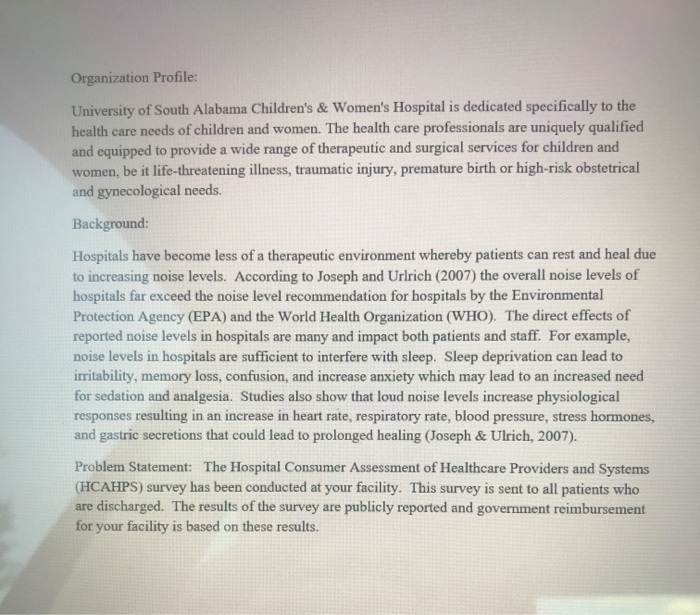
Organization Profile: University of South Alabama Children's&Women's Hospital is dedicated specifically to the health care needs of children and women. The health care professionals are uniquely qualified and equipped to provide a wide range of therapeutic and surgical services for children and women, be it life-threatening illness, traumatic injury, premature birth or high-risk obstetrical and gynecological needs. Background: Hospitals have become less of a therapeutic environment whereby patients can rest and heal due to increasing noise levels. According to Joseph and Urlrich (2007) the overall noise levels of hospitals far exceed the noise level recommendation for hospitals by the Environmental Protection Agency (EPA) and the World Health Organization (WHO). The direct effects of reported noise levels in hospitals are many and impact both patients and staff. For example, noise levels in hospitals are sufficient to interfere with sleep. Sleep deprivation can lead to irritability, memory loss, confusion, and increase anxiety which may lead to an increased need for sedation and analgesia. Studies also show that loud noise levels increase physiological responses resulting in an increase in heart rate, respiratory rate, blood pressure, stress hormones, and gastric secretions that could lead to prolonged healing (Joseph & Ulrich, 2007). Problem Statement: The Hospital Consumer Assessment of Healthcare Providers and Systems (HCAHPS) survey has been conducted at your facility. This survey is sent to all patients who are discharged. The results of the survey are publicly reported and government reimbursement for your facility is based on these results USAWC Data (1 sav [DataSet1) BM SPSS Statitics Data Editor Iransform Graphs Exdensions Edt View Data Analyze LBines Window Help A id help with room bro om clean recomme courtesy isten car respect call butto pain med needed controlle pain med explanati hospital satisfacti pain med noise nd hospit efully broom b on n help service d al pan on 1.00 Usually Usually Sometimes Usually 2.00 Yes Usually Usually Usually Definitely No Usually Probably no Always Never 2 No Always 2.00 Usually Always Sometimes Sometimes Always Sometimes 3.00 Always Usually 8 00 No Always Always Sometimes Probably no Usually Probably no 3 3.00 Sometimes Always Always Usually Usualy Always Always Sometimes 4.00 Usually Never Sometimes 3.00 Yes Never Never Never Usually Probably no 5.00 Usually Never Sometimes Sometimes Always Usually Never 2.00 Yes Never 6.00 Sometimes Usually Sometimes Usually Always Usually 9.00 Yes Usually Always Usually Probably no 7.00 Usually Usually Always Usually Never 4.00 Yes Usually Usually Always Always Probably no Always Probably no es 5.00 Yes 8.00 Usually Usually Usualy Always Usually Always Usually Always Usually 8.00 No Always Usually Usually Probably no Usually Definitaly No Usually Definitely No 9.00 Sometimes Usually Always Always Sometimes Always 10 Always Usually 200 No Always Always 10.00 Sometimes Usually Never Worst Hos 11.00 Sometimes Aways Sometimes Sometimes No Always Always 11 . Usually Best Hospt... Usually No Usually 12 12.00 Usually Always Always Usually Always Always Always Definitely No Always Probably no Always Usually Sometimes Usually Sometimes Sometimes Never 2.00 No 13 13.00 Usually Always Always Usually Usually Always Usually 5.00 Yes Sometimes Sometimes Always Probably no 14 14.00 Always Never Usually 6.00 Yes Sometimes Sometimes Always Probably no 15 15.00 Always Never 5.00 Usually Usualy Usually Usually Sometimes Yes Usually Usually Probably no 16 16.00 Sometimes Sometimes 600 Usually Usually Usually Sometimes Yes Usualy Always Always Probably no 17 17.00 Sometimes Sometimes Always Sometimes Usually Probably Y 18 18.00 Usually Usualy Always 400 Yes Usually Always Usually 5 00 Usually Always Always Sometimes 19 19.00 Always Yes Usually Usually Usually Probably Y Usually Usually Usually Probably Y Usually Sometimes 20 Usually Usually 4.00 No Usually Usually 20.00 Usually 21 Always Always Usually Always Always Sometimes 5.00 No Usually Usually Usually Probably Y Usually 22.00 Sometimes 21.00 Usually Always Usually Probably no 22 Always Usually Always Sometimes Aways Sometimes Usualy Always Sometimes 6.00 No Always Usualy Usually 23.00 No Usually Probably Y 23 Never Always Sometimes 4.00 Usually No Sometimes Always Usually Always Sometimes Probably Y Usually Sometimes Probably Y Always Probably no 24 24.00 Always Sometimes 5.00 Usually 25 25.00 Usually Always Sometimes Always Sometimes 3.00 No Always Always 26 00 Always 26 Usually Always 200 No Usualy Always Data View Variabde View M SP93 Statsbo 2 2 22 2 2 2 32 2 2 2 2 2 2 USAWC Data (1)sav DataSet1] OM SPSS Statistics Data Editon Help Exdensions Window Analze Graphs USites Data Transform Eile Edt Vew 1 19 1 pain med needed controlle recomme noise pain med help with id call butto n help hospital satisfacti pain med explanati courtesy listen car room bro service broom b nd hospit om clean efully respect on al d pan on Always Probably Y Usually No Always Sometimes 4.00 Usually Usually Always Usually Always Always 27 27.00 Usually Always Probably Y Sometimes No Always 3.00 28 Always 28.00 Always Usually Sometimes Usually Always Probably Y 2.00 Always Yes Sometimes Sometimes No 29.00 Sometimes 29 Usually Always Always Usually Sometimes Always Probably Y 3.00 30.00 Usually Never 30 Always Usually Never Usually Usually Always Definitely Yes Sometimes Sometimes Never 6.00 Never Usually Usually Usually Usually Always 31 31.00 Usually Definitely Yes Usually Usually Sometimes Usually Sometimes Usually Sometimes Never 7.00 Always Always Always 32 3200 Usually Usually Definitely 4.00 Yes Always Always Always Never 33 33.00 Usually Definitely Usually Probably Y 5.00 Yes Always Always Always Always Never 34.00 Usually 34 3.00 Yes Always Usually Always Always Always Never 35.00 Always Sometimes Usually Always 35 2.00 Yes Usually Usually Definitely Never Usually Sometimes Usually Usually Usually Always 36 36.00 Usually Probably Y Always Never 5.00 Yes Usually Usually Usually Usually Usually Always 37 37.00 Always Probably Y Never 3.00 Yes Always 38.00 Usually Usually Usually Sometimes Always Usually 38 Always Probably Y Usually Definitely Always 4.00 Yes Always Usually Never 39.00 Sometimes Usually 39 Usually Always Never 4.00 Yes Usually Always Usually Usually 40 40.00 Sometimes Always Never Worst Hos No Usually Always Usually Definitely Always Usually 41 41.00 Usually Usually Always Never 2.00 Usually Usually Definitely 42 00 Usually Always Usually No Always 42 Usually 6.00 No Usually Probably Y Always Always Never Usually Always 43 43.00 Always Always Always Always Never Sometimes Probably Y Always Always Never 7.00 No Always Always Sometimes Probably Y Always Sometimes Probably Y Always Sometimes Probably Y 44 44.00 Always Never Usually Always Never 5.00 45 45.00 Always Sometimes Always No Sometimes 46 Always Always Never 6.00 No Sometimes 46.00 Always Always Sometimes Usually Usually Never 200 No Always 47 47.00 Always Always Always Usually Always Sometimes Probably Y Always Definitely 48 Never 3.00 No 48.00 Always Always Always Always Always Usually Always 49 49 00 Always Always Always Usually Usually Never 4.00 No Always Usually 50.00 50 Always Usually Usually Never 5 00 No Always Usually Always Definitely 62 Vartable Mew Data View 1B 8 USAWC Data (1)sav [DataSet1)-18M SPSS Statistics Data Editor Transform Help Graphs Extensions Window Edit Analyze Utilities Fle Vew Data Measure Role Columns Align Missing Decimals Label Values Type Width Name Scale Input Input Right Participant ID During this hos During this hos... (1.00, Never... None During this hos. During this hos.. (1.00, Never.. None During this hos... (1.00, Never... None 8 8 None None Numeric 2 1 id Nominal Right (1.00, Never.None cOurtesy re.. Numeric 2 Input Nominal Right 2 listen caref. Numeric 3 Nominal Nominal Nominal Nominal Nominal Nominal Input Right explanation call button 2 (1.00, Never... None 4 Numeric Input 8 Right Right Right , Numeric 2 5 Input 8 2 6 room broo Numeric Input (1.00, Never None (1.00, Wors None 8 noise Numeric 2 During this hos 7 Input Right hospital sat Numeric 2 Using any num Input Right Right Right Right Right During this hos During this hos During this hos.. (1.00, Never.. None How often did y.. (1.00, Never.. None 2 (1.00, Yes) None Numeric 9 pain med n Input (1.00, Never... None Nominal 2 10 pain med c Numeric Input pain med s. Numeric help with b Nominal 2 11 Input Nominal 2 12 Numeric Input 8 Nominal Would you reco (1.00, Defini None 2 13 recommend Numeric 14 HCAHPS Survey 1. During this hospital stay, how often did nurses treat you with courtesy and respect? O Never (1) (2) (3) 0 Sometimes O Usually OAlways (4) 2. During this hospital stay, how often did nurses listen carefully to you? Never (1) Sometimes (2) (3) O Usually O Always (4) 3. During this hospital stay, how often did nurses explain things in a way you could understand? Never (1) Sometimes (2) Usually (3) Always (4) 4. During this hospital stay, after you pressed the call button, how often did you get help as soon as you wanted it? (1) Never (2) (3) Sometimes Usually O Always (4) 5. During this hospital stay, how often were your room and bathroom kept clean? Never (1) Sometimes (2) Usually (3) Always (4) 7. During this hospital say, did you need medicine for pain? (1) Yes No (2) 8. During this hospital stay, how often was your pain well controlled? (1) Never Sometimes (2) (3) (4) OUsually OAlways 9. During this hospital stay, how often did the hospital staff do everything they could to help you with V your pain? (1) Never Sometimes (2) O Usually O Always (3) (4) 10. How often did you get help in getting to the bathroom or in using a bedpan as soon as you wanted? Never (1) (2) Sometimes Usually (3) OAlways (4) 11. Using any number from 0 to 10, where 0 is the worst hospital possible and 10 is the best hospital possible, what number would you use to rate this hospital during your stay? 1 Worse hospital possible (1) (2) (3) 4 (4) 5 8 10 Best hospital possible un 6N o 12. Would you recommend this hospital to your friends and family? ODefinitely No (1) O Probably No (2) Probably Yes (3) Definitely yes (4) Qualty Improvement Case Gap Analysis Assignment Informaion needed for this assignment can be found in the forum section of USAonine For this assigment each student will be ansigned a scenaio with background informaion and a data set from a healthcare organization This assignment has three parts 1. Each shudert wit first need to seview the data to determine the organiration's area(s) of needed improvement Ater analyring the scenario and data, the shudent will submt information kdentlying the area of improvement (use data analysis as evidence for te need) For this part of the assignment, you wil need to run desorptive statistics (Cronk-Chapters 1-3) HOW TO USE SPSS R Intaain A STEP-BY-STEP GUIDE TO ANALYSIS AND INTERPRETATION BRIAN C. CRONK TENTH EDITION oMa ROUTLEDGE Organization Profile: University of South Alabama Children's&Women's Hospital is dedicated specifically to the health care needs of children and women. The health care professionals are uniquely qualified and equipped to provide a wide range of therapeutic and surgical services for children and women, be it life-threatening illness, traumatic injury, premature birth or high-risk obstetrical and gynecological needs. Background: Hospitals have become less of a therapeutic environment whereby patients can rest and heal due to increasing noise levels. According to Joseph and Urlrich (2007) the overall noise levels of hospitals far exceed the noise level recommendation for hospitals by the Environmental Protection Agency (EPA) and the World Health Organization (WHO). The direct effects of reported noise levels in hospitals are many and impact both patients and staff. For example, noise levels in hospitals are sufficient to interfere with sleep. Sleep deprivation can lead to irritability, memory loss, confusion, and increase anxiety which may lead to an increased need for sedation and analgesia. Studies also show that loud noise levels increase physiological responses resulting in an increase in heart rate, respiratory rate, blood pressure, stress hormones, and gastric secretions that could lead to prolonged healing (Joseph & Ulrich, 2007). Problem Statement: The Hospital Consumer Assessment of Healthcare Providers and Systems (HCAHPS) survey has been conducted at your facility. This survey is sent to all patients who are discharged. The results of the survey are publicly reported and government reimbursement for your facility is based on these results USAWC Data (1 sav [DataSet1) BM SPSS Statitics Data Editor Iransform Graphs Exdensions Edt View Data Analyze LBines Window Help A id help with room bro om clean recomme courtesy isten car respect call butto pain med needed controlle pain med explanati hospital satisfacti pain med noise nd hospit efully broom b on n help service d al pan on 1.00 Usually Usually Sometimes Usually 2.00 Yes Usually Usually Usually Definitely No Usually Probably no Always Never 2 No Always 2.00 Usually Always Sometimes Sometimes Always Sometimes 3.00 Always Usually 8 00 No Always Always Sometimes Probably no Usually Probably no 3 3.00 Sometimes Always Always Usually Usualy Always Always Sometimes 4.00 Usually Never Sometimes 3.00 Yes Never Never Never Usually Probably no 5.00 Usually Never Sometimes Sometimes Always Usually Never 2.00 Yes Never 6.00 Sometimes Usually Sometimes Usually Always Usually 9.00 Yes Usually Always Usually Probably no 7.00 Usually Usually Always Usually Never 4.00 Yes Usually Usually Always Always Probably no Always Probably no es 5.00 Yes 8.00 Usually Usually Usualy Always Usually Always Usually Always Usually 8.00 No Always Usually Usually Probably no Usually Definitaly No Usually Definitely No 9.00 Sometimes Usually Always Always Sometimes Always 10 Always Usually 200 No Always Always 10.00 Sometimes Usually Never Worst Hos 11.00 Sometimes Aways Sometimes Sometimes No Always Always 11 . Usually Best Hospt... Usually No Usually 12 12.00 Usually Always Always Usually Always Always Always Definitely No Always Probably no Always Usually Sometimes Usually Sometimes Sometimes Never 2.00 No 13 13.00 Usually Always Always Usually Usually Always Usually 5.00 Yes Sometimes Sometimes Always Probably no 14 14.00 Always Never Usually 6.00 Yes Sometimes Sometimes Always Probably no 15 15.00 Always Never 5.00 Usually Usualy Usually Usually Sometimes Yes Usually Usually Probably no 16 16.00 Sometimes Sometimes 600 Usually Usually Usually Sometimes Yes Usualy Always Always Probably no 17 17.00 Sometimes Sometimes Always Sometimes Usually Probably Y 18 18.00 Usually Usualy Always 400 Yes Usually Always Usually 5 00 Usually Always Always Sometimes 19 19.00 Always Yes Usually Usually Usually Probably Y Usually Usually Usually Probably Y Usually Sometimes 20 Usually Usually 4.00 No Usually Usually 20.00 Usually 21 Always Always Usually Always Always Sometimes 5.00 No Usually Usually Usually Probably Y Usually 22.00 Sometimes 21.00 Usually Always Usually Probably no 22 Always Usually Always Sometimes Aways Sometimes Usualy Always Sometimes 6.00 No Always Usualy Usually 23.00 No Usually Probably Y 23 Never Always Sometimes 4.00 Usually No Sometimes Always Usually Always Sometimes Probably Y Usually Sometimes Probably Y Always Probably no 24 24.00 Always Sometimes 5.00 Usually 25 25.00 Usually Always Sometimes Always Sometimes 3.00 No Always Always 26 00 Always 26 Usually Always 200 No Usualy Always Data View Variabde View M SP93 Statsbo 2 2 22 2 2 2 32 2 2 2 2 2 2 USAWC Data (1)sav DataSet1] OM SPSS Statistics Data Editon Help Exdensions Window Analze Graphs USites Data Transform Eile Edt Vew 1 19 1 pain med needed controlle recomme noise pain med help with id call butto n help hospital satisfacti pain med explanati courtesy listen car room bro service broom b nd hospit om clean efully respect on al d pan on Always Probably Y Usually No Always Sometimes 4.00 Usually Usually Always Usually Always Always 27 27.00 Usually Always Probably Y Sometimes No Always 3.00 28 Always 28.00 Always Usually Sometimes Usually Always Probably Y 2.00 Always Yes Sometimes Sometimes No 29.00 Sometimes 29 Usually Always Always Usually Sometimes Always Probably Y 3.00 30.00 Usually Never 30 Always Usually Never Usually Usually Always Definitely Yes Sometimes Sometimes Never 6.00 Never Usually Usually Usually Usually Always 31 31.00 Usually Definitely Yes Usually Usually Sometimes Usually Sometimes Usually Sometimes Never 7.00 Always Always Always 32 3200 Usually Usually Definitely 4.00 Yes Always Always Always Never 33 33.00 Usually Definitely Usually Probably Y 5.00 Yes Always Always Always Always Never 34.00 Usually 34 3.00 Yes Always Usually Always Always Always Never 35.00 Always Sometimes Usually Always 35 2.00 Yes Usually Usually Definitely Never Usually Sometimes Usually Usually Usually Always 36 36.00 Usually Probably Y Always Never 5.00 Yes Usually Usually Usually Usually Usually Always 37 37.00 Always Probably Y Never 3.00 Yes Always 38.00 Usually Usually Usually Sometimes Always Usually 38 Always Probably Y Usually Definitely Always 4.00 Yes Always Usually Never 39.00 Sometimes Usually 39 Usually Always Never 4.00 Yes Usually Always Usually Usually 40 40.00 Sometimes Always Never Worst Hos No Usually Always Usually Definitely Always Usually 41 41.00 Usually Usually Always Never 2.00 Usually Usually Definitely 42 00 Usually Always Usually No Always 42 Usually 6.00 No Usually Probably Y Always Always Never Usually Always 43 43.00 Always Always Always Always Never Sometimes Probably Y Always Always Never 7.00 No Always Always Sometimes Probably Y Always Sometimes Probably Y Always Sometimes Probably Y 44 44.00 Always Never Usually Always Never 5.00 45 45.00 Always Sometimes Always No Sometimes 46 Always Always Never 6.00 No Sometimes 46.00 Always Always Sometimes Usually Usually Never 200 No Always 47 47.00 Always Always Always Usually Always Sometimes Probably Y Always Definitely 48 Never 3.00 No 48.00 Always Always Always Always Always Usually Always 49 49 00 Always Always Always Usually Usually Never 4.00 No Always Usually 50.00 50 Always Usually Usually Never 5 00 No Always Usually Always Definitely 62 Vartable Mew Data View 1B 8 USAWC Data (1)sav [DataSet1)-18M SPSS Statistics Data Editor Transform Help Graphs Extensions Window Edit Analyze Utilities Fle Vew Data Measure Role Columns Align Missing Decimals Label Values Type Width Name Scale Input Input Right Participant ID During this hos During this hos... (1.00, Never... None During this hos. During this hos.. (1.00, Never.. None During this hos... (1.00, Never... None 8 8 None None Numeric 2 1 id Nominal Right (1.00, Never.None cOurtesy re.. Numeric 2 Input Nominal Right 2 listen caref. Numeric 3 Nominal Nominal Nominal Nominal Nominal Nominal Input Right explanation call button 2 (1.00, Never... None 4 Numeric Input 8 Right Right Right , Numeric 2 5 Input 8 2 6 room broo Numeric Input (1.00, Never None (1.00, Wors None 8 noise Numeric 2 During this hos 7 Input Right hospital sat Numeric 2 Using any num Input Right Right Right Right Right During this hos During this hos During this hos.. (1.00, Never.. None How often did y.. (1.00, Never.. None 2 (1.00, Yes) None Numeric 9 pain med n Input (1.00, Never... None Nominal 2 10 pain med c Numeric Input pain med s. Numeric help with b Nominal 2 11 Input Nominal 2 12 Numeric Input 8 Nominal Would you reco (1.00, Defini None 2 13 recommend Numeric 14 HCAHPS Survey 1. During this hospital stay, how often did nurses treat you with courtesy and respect? O Never (1) (2) (3) 0 Sometimes O Usually OAlways (4) 2. During this hospital stay, how often did nurses listen carefully to you? Never (1) Sometimes (2) (3) O Usually O Always (4) 3. During this hospital stay, how often did nurses explain things in a way you could understand? Never (1) Sometimes (2) Usually (3) Always (4) 4. During this hospital stay, after you pressed the call button, how often did you get help as soon as you wanted it? (1) Never (2) (3) Sometimes Usually O Always (4) 5. During this hospital stay, how often were your room and bathroom kept clean? Never (1) Sometimes (2) Usually (3) Always (4) 7. During this hospital say, did you need medicine for pain? (1) Yes No (2) 8. During this hospital stay, how often was your pain well controlled? (1) Never Sometimes (2) (3) (4) OUsually OAlways 9. During this hospital stay, how often did the hospital staff do everything they could to help you with V your pain? (1) Never Sometimes (2) O Usually O Always (3) (4) 10. How often did you get help in getting to the bathroom or in using a bedpan as soon as you wanted? Never (1) (2) Sometimes Usually (3) OAlways (4) 11. Using any number from 0 to 10, where 0 is the worst hospital possible and 10 is the best hospital possible, what number would you use to rate this hospital during your stay? 1 Worse hospital possible (1) (2) (3) 4 (4) 5 8 10 Best hospital possible un 6N o 12. Would you recommend this hospital to your friends and family? ODefinitely No (1) O Probably No (2) Probably Yes (3) Definitely yes (4) Qualty Improvement Case Gap Analysis Assignment Informaion needed for this assignment can be found in the forum section of USAonine For this assigment each student will be ansigned a scenaio with background informaion and a data set from a healthcare organization This assignment has three parts 1. Each shudert wit first need to seview the data to determine the organiration's area(s) of needed improvement Ater analyring the scenario and data, the shudent will submt information kdentlying the area of improvement (use data analysis as evidence for te need) For this part of the assignment, you wil need to run desorptive statistics (Cronk-Chapters 1-3) HOW TO USE SPSS R Intaain A STEP-BY-STEP GUIDE TO ANALYSIS AND INTERPRETATION BRIAN C. CRONK TENTH EDITION oMa ROUTLEDGEStep by Step Solution
There are 3 Steps involved in it
Step: 1

Get Instant Access to Expert-Tailored Solutions
See step-by-step solutions with expert insights and AI powered tools for academic success
Step: 2

Step: 3

Ace Your Homework with AI
Get the answers you need in no time with our AI-driven, step-by-step assistance
Get Started


