Answered step by step
Verified Expert Solution
Link Copied!

Question

1 Approved Answer

Using temperature data from the experimental runs a graph is created plotting ink versus 1/T where T is in Kelvin. The best fit line for
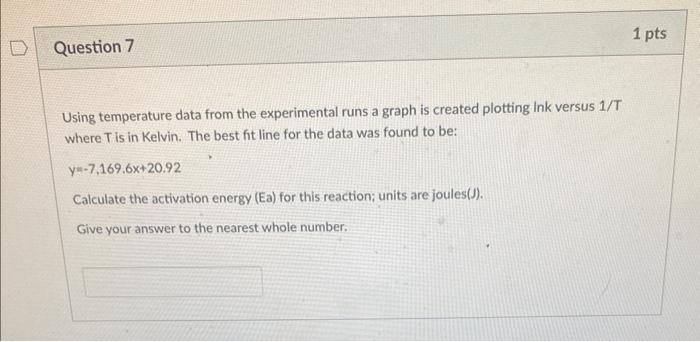
image text in transcribed
Using temperature data from the experimental runs a graph is created plotting ink versus 1/T where T is in Kelvin. The best fit line for the data was found to be: y=7,169.6x+20.92 Calculate the activation energy (Ea) for this reaction; units are joules(J). Give your answer to the nearest whole number

Step by Step Solution

There are 3 Steps involved in it

Step: 1

blur-text-image

Get Instant Access to Expert-Tailored Solutions

See step-by-step solutions with expert insights and AI powered tools for academic success

Step: 2

blur-text-image

Step: 3

blur-text-image

Ace Your Homework with AI

Get the answers you need in no time with our AI-driven, step-by-step assistance

Get Started

Recommended Textbook for

General Chemisty

Authors: John E. McMurry, Robert C. Fay

2nd Edition

1269962175, 978-1269962179

More Books

Students also viewed these Chemistry questions

Question

Which customer did the company sell the most to in November?

Answered: 1 week ago

Question

What is the combined tax rate for Alabama (AL)?

Answered: 1 week ago