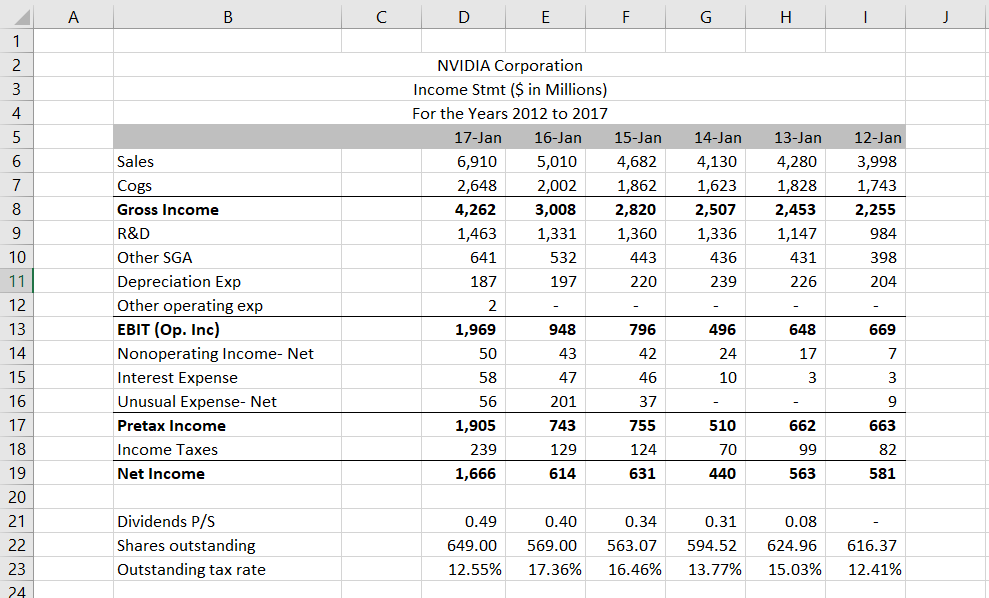
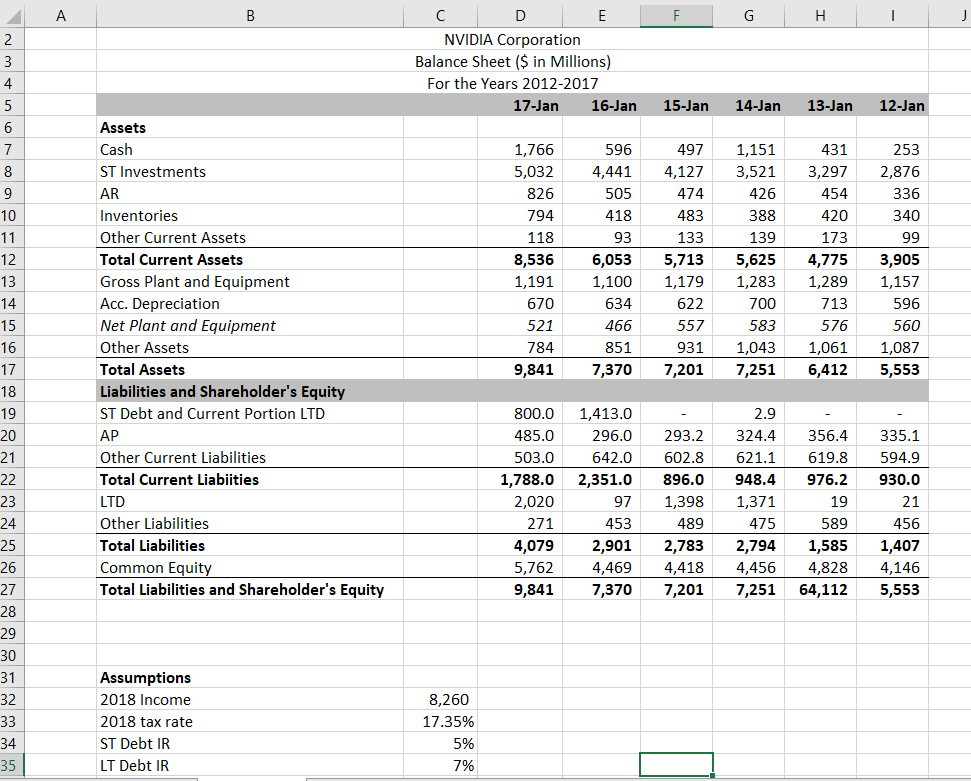
 using the above balance sheet and income statement, forecast the items on the income statement and balance sheet for 2018 using the percent of sales method. What is the discretionary financing needed in 2018? Assume that the dividends per share will be $0.54 and the number of shares will be the same as in 2017. Analysts forecast that its 2018 sales will be $8,260. The expected 2018 tax rate will be 17.35%. Assume the firm pays 5% interest on short-term debt and 7% on long term debt.
A B C D E F G H J 1 2 3 4 5 NVIDIA Corporation Income Stmt ($ in Millions) For the Years 2012 to 2017 17-Jan 16-Jan 15-Jan 6,910 5,010 4,682 2,648 2,002 1,862 4,262 3,008 2,820 1,463 1,331 1,360 641 532 443 187 197 220 14-Jan 4,130 1,623 2,507 1,336 13-Jan 4,280 1,828 2,453 1,147 431 226 12-Jan 3,998 1,743 2,255 984 436 398 239 204 2 Sales Cogs Gross Income R&D Other SGA Depreciation Exp Other operating exp EBIT (Op. Inc) Nonoperating Income-Net Interest Expense Unusual Expense-Net Pretax Income Income Taxes Net Income 796 496 648 669 1,969 50 948 43 42 24 6 7 8 9 10 11 12 13 14 15 16 17 18 19 20 21 22 23 24 7 17 3 58 47 46 10 3 56 201 37 9 743 510 662 663 1,905 239 1,666 755 124 631 70 129 614 99 82 581 440 563 0.49 0.34 0.31 0.08 Dividends P/S Shares outstanding Outstanding tax rate 649.00 12.55% 0.40 569.00 17.36% 563.07 16.46% 594.52 13.77% 624.96 15.03% 616.37 12.41% A B G H J C D E NVIDIA Corporation Balance Sheet ($ in Millions) For the Years 2012-2017 17-Jan 16-Jan 15-Jan 14-Jan 13-Jan 12-Jan 1,766 5,032 826 794 118 8,536 1,191 670 521 784 9,841 596 4,441 505 418 93 6,053 1,100 634 466 851 7,370 Assets Cash ST Investments AR Inventories Other Current Assets Total Current Assets Gross Plant and Equipment Acc. Depreciation Net Plant and Equipment Other Assets Total Assets Liabilities and Shareholder's Equity ST Debt and Current Portion LTD AP Other Current Liabilities Total Current Liabiities LTD Other Liabilities Total Liabilities Common Equity Total Liabilities and Shareholder's Equity 497 4,127 474 483 133 5,713 1,179 622 557 931 7,201 1,151 3,521 426 388 139 5,625 1,283 700 583 1,043 7,251 431 3,297 454 420 173 4,775 1,289 253 2,876 336 340 99 3,905 1,157 596 560 1,087 5,553 713 2. 3 4 5 6 7 8 9 10 11 12 13 14 15 16 17 18 19 20 21 22 23 24 25 26 27 28 29 30 31 32 33 34 35 576 1,061 6,412 2.9 324.4 800.0 485.0 503.0 1,788.0 2,020 271 4,079 5,762 9,841 1,413.0 296.0 642.0 2,351.0 97 453 2,901 4,469 7,370 293.2 602.8 896.0 1,398 489 2,783 4,418 7,201 621.1 948.4 1,371 475 2,794 4,456 7,251 356.4 619.8 976.2 19 589 1,585 4,828 64,112 335.1 594.9 930.0 21 456 1,407 4,146 5,553 Assumptions 2018 Income 2018 tax rate ST Debt IR LT Debt IR 8,260 17.35% 5% 7% A B C D E F G H J 1 2 3 4 5 NVIDIA Corporation Income Stmt ($ in Millions) For the Years 2012 to 2017 17-Jan 16-Jan 15-Jan 6,910 5,010 4,682 2,648 2,002 1,862 4,262 3,008 2,820 1,463 1,331 1,360 641 532 443 187 197 220 14-Jan 4,130 1,623 2,507 1,336 13-Jan 4,280 1,828 2,453 1,147 431 226 12-Jan 3,998 1,743 2,255 984 436 398 239 204 2 Sales Cogs Gross Income R&D Other SGA Depreciation Exp Other operating exp EBIT (Op. Inc) Nonoperating Income-Net Interest Expense Unusual Expense-Net Pretax Income Income Taxes Net Income 796 496 648 669 1,969 50 948 43 42 24 6 7 8 9 10 11 12 13 14 15 16 17 18 19 20 21 22 23 24 7 17 3 58 47 46 10 3 56 201 37 9 743 510 662 663 1,905 239 1,666 755 124 631 70 129 614 99 82 581 440 563 0.49 0.34 0.31 0.08 Dividends P/S Shares outstanding Outstanding tax rate 649.00 12.55% 0.40 569.00 17.36% 563.07 16.46% 594.52 13.77% 624.96 15.03% 616.37 12.41% A B G H J C D E NVIDIA Corporation Balance Sheet ($ in Millions) For the Years 2012-2017 17-Jan 16-Jan 15-Jan 14-Jan 13-Jan 12-Jan 1,766 5,032 826 794 118 8,536 1,191 670 521 784 9,841 596 4,441 505 418 93 6,053 1,100 634 466 851 7,370 Assets Cash ST Investments AR Inventories Other Current Assets Total Current Assets Gross Plant and Equipment Acc. Depreciation Net Plant and Equipment Other Assets Total Assets Liabilities and Shareholder's Equity ST Debt and Current Portion LTD AP Other Current Liabilities Total Current Liabiities LTD Other Liabilities Total Liabilities Common Equity Total Liabilities and Shareholder's Equity 497 4,127 474 483 133 5,713 1,179 622 557 931 7,201 1,151 3,521 426 388 139 5,625 1,283 700 583 1,043 7,251 431 3,297 454 420 173 4,775 1,289 253 2,876 336 340 99 3,905 1,157 596 560 1,087 5,553 713 2. 3 4 5 6 7 8 9 10 11 12 13 14 15 16 17 18 19 20 21 22 23 24 25 26 27 28 29 30 31 32 33 34 35 576 1,061 6,412 2.9 324.4 800.0 485.0 503.0 1,788.0 2,020 271 4,079 5,762 9,841 1,413.0 296.0 642.0 2,351.0 97 453 2,901 4,469 7,370 293.2 602.8 896.0 1,398 489 2,783 4,418 7,201 621.1 948.4 1,371 475 2,794 4,456 7,251 356.4 619.8 976.2 19 589 1,585 4,828 64,112 335.1 594.9 930.0 21 456 1,407 4,146 5,553 Assumptions 2018 Income 2018 tax rate ST Debt IR LT Debt IR 8,260 17.35% 5% 7%