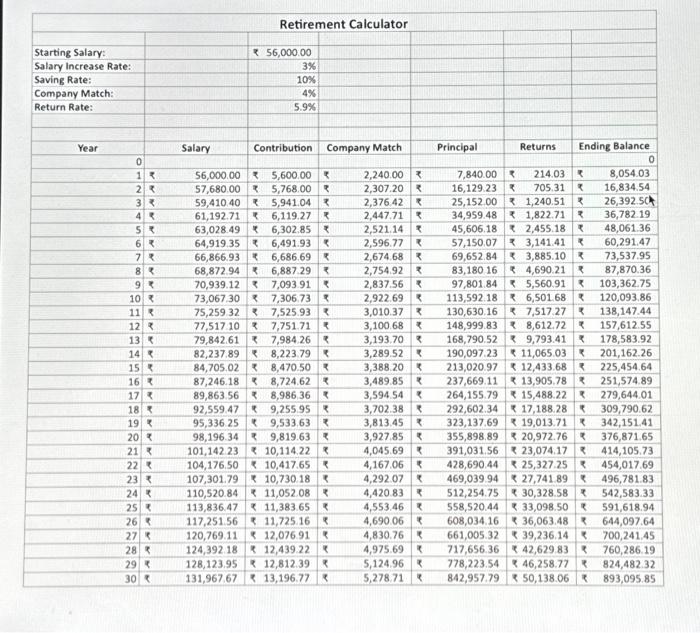
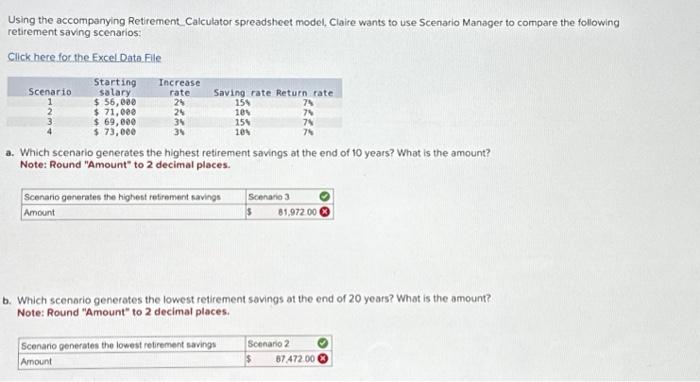
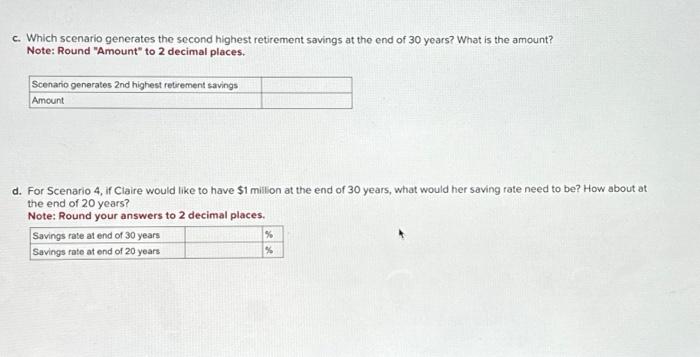
Using the accompanying Retirement Calculator spreadsheet model, Claire wants to use Scenario Manager to compare the following retirement saving scenarios: Click here for the Excel Data File a. Which scenario generates the highest retirement savings at the end of 10 years? What is the amount? Note: Round "Amount" to 2 decimal places. b. Which scenorio generates the lowest retirement savings at the end of 20 years? What is the amount? Note: Round "Amount" to 2 decimal places. \begin{tabular}{|c|c|c|c|c|c|c|c|c|c|c|c|} \hline \multicolumn{12}{|c|}{ Retirement Calculator } \\ \hline & & & & & & & & & & & \\ \hline Starting Salary: & & & e & 56,000,00 & & & & & & & \\ \hline Salary Increase Rate: & & & & 3% & & & & & & & \\ \hline Saving Rate: & & & & 10% & & & & & & & \\ \hline Company Match: & & & & 4% & & & & & & & \\ \hline Return Rate: & & & & 5.9% & & & & & & & \\ \hline & & & & & & & & & & & \\ \hline Year & & Salary & & Contribution & & any Match & & Principal & Returns & & ding Balance \\ \hline 0 & & & & & & & & & & & 0 \\ \hline 1 & & 56,000.00 & & 5,600.00 & & 2,240.00 & & 7,840.00 & 214.03 & 8 & 8,054.03 \\ \hline 2 & & 57,680.00 & & 5,768.00 & & 2,307.20 & & 16,129.23 & 705.31 & & 16,834.54 \\ \hline 3 & 2 & 59,410.40 & & 5,941.04 & & 2,376.42 & & 25,15200 & 1,240.51 & & 26,392.5C \\ \hline 4 & ? & 61,192.71 & & 6,119.27 & & 2,447.71 & & 34,959.48 & 1,822.71 & & 36,782.19 \\ \hline 5 & & 63,028.49 & & 6,302.85 & & 2,521.14 & & 45,606.18 & 2,455.18 & & 48,061.36 \\ \hline 6 & & 64,919,35 & & 6,491.93 & & 2,596.77 & & 57,150.07 & 3,141.41 & & 60,291.47 \\ \hline 7 & & 66,866.93 & & 6,686.69 & & 2,674.68 & & 69,652.84 & 3,885.10 & & 73,537.95 \\ \hline 8 & & 68,872.94 & & 6,887.29 & & 2,754.92 & & 83,18016 & 4,690.21 & & 87,870.36 \\ \hline 9 & & 70,939.12 & & 7,093.91 & & 2,837.56 & & 97,801.84 & P 5,560.91 & & 103,362.75 \\ \hline 10 & & 73,067.30 & & 7,306.73 & & 2,922.69 & & 113,592.18 & 6,501.68 & & 120,093.86 \\ \hline 11 & & 75,25932 & & 7,525.93 & & 3,010.37 & & 130,630.16 & 7,517.27 & & 138,147.44 \\ \hline 12 & & 77,517.10 & & 7,751.71 & ? & 3,100.68 & & 148,999.83 & 8,612,72 & & 157,612.55 \\ \hline 13 & & 79,842.61 & & 7,984.26 & & 3,193.70 & & 168,790.52 & 9,793.41 & & 178,583.92 \\ \hline 14 & & 82,237.89 & & 8,223.79 & & 3,289.52 & & 190,097.23 & 11,065.03 & & 201,162.26 \\ \hline 15 & & 84,705.02 & & 8,470.50 & & 3,388.20 & & 213,020.97 & 12,433.68 & & 225,454.64 \\ \hline 16 & & 87,246.18 & & 8,724.62 & ? & 3,489.85 & & 237,669.11 & 13,905.78 & & 251,574.89 \\ \hline 17 & ? & 89,863.56 & & 8,986,36 & & 3,594.54 & & 264,155.79 & 15,488.22 & & 279,644.01 \\ \hline 18 & & 92,559.47 & & 9,25595 & & 3,702.38 & & 292,602.34 & 17,188.28 & & 309,790.62 \\ \hline 19 & & 95,336.25 & s & 9,533.63 & & 3,813,45 & & 323,137.69 & 19,013.71 & & 342,151,41 \\ \hline 20 & & 98,196.34 & & 9,819.63 & & 3,927,85 & & 355,898.89 & 20,972.76 & & 376,871.65 \\ \hline 21 & & 101,142.23 & & 10,114.22 & x & 4,045.69 & & 391,031.56 & 23,074.17 & & 414,105.73 \\ \hline 22 & & 104,176.50 & & 10,417.65 & ? & 4,167.06 & & 428,690.44 & 25,327.25 & & 454,017.69 \\ \hline 23 & & 107,301.79 & & 10,730.18 & & 4,292.07 & & 469,03994 & 27,741.89 & & 496,781.83 \\ \hline 24 & & 110,520.84 & & 11,052.08 & & 4,420.83 & & 512,254.75 & 30,328.58 & & 542,583.33 \\ \hline 25 & & 113,836.47 & & 11,383.65 & & 4,553.46 & & 558,520.44 & 33,098.50 & & 591,618.94 \\ \hline 26 & & 117,251.56 & & 11,725.16 & & 4,690.06 & & 608,034.16 & 36,063.48 & & 644,097.64 \\ \hline 27 & i & 120,769.11 & 5 & 12,076.91 & & 4,830.76 & & 661,005.32 & 39,236.14 & & 700,241.45 \\ \hline 28 & & 124,392.18 & & 12,439.22 & 7 & 4,975.69 & & 717,656.36 & 42,629.83 & ? & 760,286.19 \\ \hline 29 & & 128,123.95 & 8 & 12,812.39 & & 5,124.96 & & 778,223.54 & 46,258.77 & R & 824,482.32 \\ \hline 30 & & 131,967.67 & 5 & 13,196.77 & & 5,278.71 & Q & 842,957.79 & 50,138.06 & & 893,095.85 \\ \hline \end{tabular} -Which scenario generates the second highest retirement savings at the end of 30 years? What is the amount? Note: Round "Amount" to 2 decimal places. d. For Scenario 4, if Claire would like to have $1 milion at the end of 30 years, what would her saving rate need to be? How about at the end of 20 years? Note: Round your answers to 2 decimal places. Using the accompanying Retirement Calculator spreadsheet model, Claire wants to use Scenario Manager to compare the following retirement saving scenarios: Click here for the Excel Data File a. Which scenario generates the highest retirement savings at the end of 10 years? What is the amount? Note: Round "Amount" to 2 decimal places. b. Which scenorio generates the lowest retirement savings at the end of 20 years? What is the amount? Note: Round "Amount" to 2 decimal places. \begin{tabular}{|c|c|c|c|c|c|c|c|c|c|c|c|} \hline \multicolumn{12}{|c|}{ Retirement Calculator } \\ \hline & & & & & & & & & & & \\ \hline Starting Salary: & & & e & 56,000,00 & & & & & & & \\ \hline Salary Increase Rate: & & & & 3% & & & & & & & \\ \hline Saving Rate: & & & & 10% & & & & & & & \\ \hline Company Match: & & & & 4% & & & & & & & \\ \hline Return Rate: & & & & 5.9% & & & & & & & \\ \hline & & & & & & & & & & & \\ \hline Year & & Salary & & Contribution & & any Match & & Principal & Returns & & ding Balance \\ \hline 0 & & & & & & & & & & & 0 \\ \hline 1 & & 56,000.00 & & 5,600.00 & & 2,240.00 & & 7,840.00 & 214.03 & 8 & 8,054.03 \\ \hline 2 & & 57,680.00 & & 5,768.00 & & 2,307.20 & & 16,129.23 & 705.31 & & 16,834.54 \\ \hline 3 & 2 & 59,410.40 & & 5,941.04 & & 2,376.42 & & 25,15200 & 1,240.51 & & 26,392.5C \\ \hline 4 & ? & 61,192.71 & & 6,119.27 & & 2,447.71 & & 34,959.48 & 1,822.71 & & 36,782.19 \\ \hline 5 & & 63,028.49 & & 6,302.85 & & 2,521.14 & & 45,606.18 & 2,455.18 & & 48,061.36 \\ \hline 6 & & 64,919,35 & & 6,491.93 & & 2,596.77 & & 57,150.07 & 3,141.41 & & 60,291.47 \\ \hline 7 & & 66,866.93 & & 6,686.69 & & 2,674.68 & & 69,652.84 & 3,885.10 & & 73,537.95 \\ \hline 8 & & 68,872.94 & & 6,887.29 & & 2,754.92 & & 83,18016 & 4,690.21 & & 87,870.36 \\ \hline 9 & & 70,939.12 & & 7,093.91 & & 2,837.56 & & 97,801.84 & P 5,560.91 & & 103,362.75 \\ \hline 10 & & 73,067.30 & & 7,306.73 & & 2,922.69 & & 113,592.18 & 6,501.68 & & 120,093.86 \\ \hline 11 & & 75,25932 & & 7,525.93 & & 3,010.37 & & 130,630.16 & 7,517.27 & & 138,147.44 \\ \hline 12 & & 77,517.10 & & 7,751.71 & ? & 3,100.68 & & 148,999.83 & 8,612,72 & & 157,612.55 \\ \hline 13 & & 79,842.61 & & 7,984.26 & & 3,193.70 & & 168,790.52 & 9,793.41 & & 178,583.92 \\ \hline 14 & & 82,237.89 & & 8,223.79 & & 3,289.52 & & 190,097.23 & 11,065.03 & & 201,162.26 \\ \hline 15 & & 84,705.02 & & 8,470.50 & & 3,388.20 & & 213,020.97 & 12,433.68 & & 225,454.64 \\ \hline 16 & & 87,246.18 & & 8,724.62 & ? & 3,489.85 & & 237,669.11 & 13,905.78 & & 251,574.89 \\ \hline 17 & ? & 89,863.56 & & 8,986,36 & & 3,594.54 & & 264,155.79 & 15,488.22 & & 279,644.01 \\ \hline 18 & & 92,559.47 & & 9,25595 & & 3,702.38 & & 292,602.34 & 17,188.28 & & 309,790.62 \\ \hline 19 & & 95,336.25 & s & 9,533.63 & & 3,813,45 & & 323,137.69 & 19,013.71 & & 342,151,41 \\ \hline 20 & & 98,196.34 & & 9,819.63 & & 3,927,85 & & 355,898.89 & 20,972.76 & & 376,871.65 \\ \hline 21 & & 101,142.23 & & 10,114.22 & x & 4,045.69 & & 391,031.56 & 23,074.17 & & 414,105.73 \\ \hline 22 & & 104,176.50 & & 10,417.65 & ? & 4,167.06 & & 428,690.44 & 25,327.25 & & 454,017.69 \\ \hline 23 & & 107,301.79 & & 10,730.18 & & 4,292.07 & & 469,03994 & 27,741.89 & & 496,781.83 \\ \hline 24 & & 110,520.84 & & 11,052.08 & & 4,420.83 & & 512,254.75 & 30,328.58 & & 542,583.33 \\ \hline 25 & & 113,836.47 & & 11,383.65 & & 4,553.46 & & 558,520.44 & 33,098.50 & & 591,618.94 \\ \hline 26 & & 117,251.56 & & 11,725.16 & & 4,690.06 & & 608,034.16 & 36,063.48 & & 644,097.64 \\ \hline 27 & i & 120,769.11 & 5 & 12,076.91 & & 4,830.76 & & 661,005.32 & 39,236.14 & & 700,241.45 \\ \hline 28 & & 124,392.18 & & 12,439.22 & 7 & 4,975.69 & & 717,656.36 & 42,629.83 & ? & 760,286.19 \\ \hline 29 & & 128,123.95 & 8 & 12,812.39 & & 5,124.96 & & 778,223.54 & 46,258.77 & R & 824,482.32 \\ \hline 30 & & 131,967.67 & 5 & 13,196.77 & & 5,278.71 & Q & 842,957.79 & 50,138.06 & & 893,095.85 \\ \hline \end{tabular} -Which scenario generates the second highest retirement savings at the end of 30 years? What is the amount? Note: Round "Amount" to 2 decimal places. d. For Scenario 4, if Claire would like to have $1 milion at the end of 30 years, what would her saving rate need to be? How about at the end of 20 years? Note: Round your answers to 2 decimal places


