

Answered step by step
Verified Expert Solution
Question
1 Approved Answer
Using the accompanying Student Grades data, construct a scatter chart for midterm versus final exam grades and add a linear trendline. What is the model?
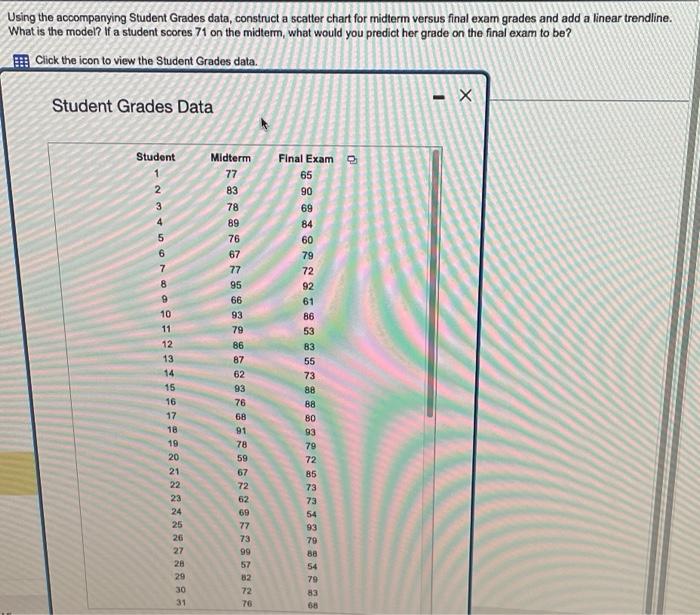
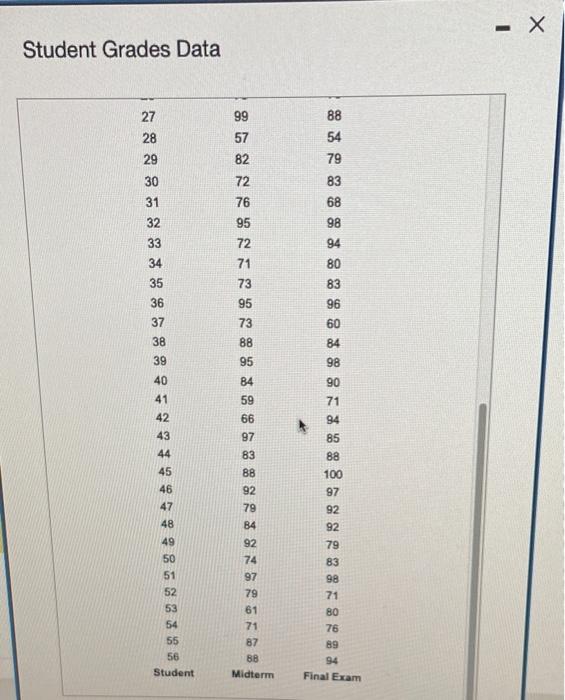
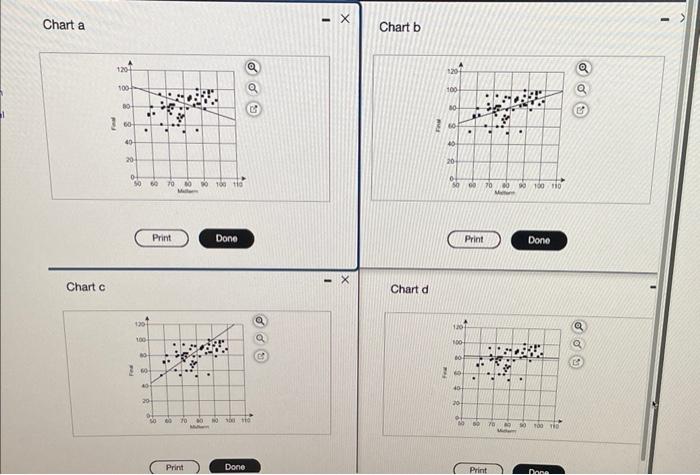
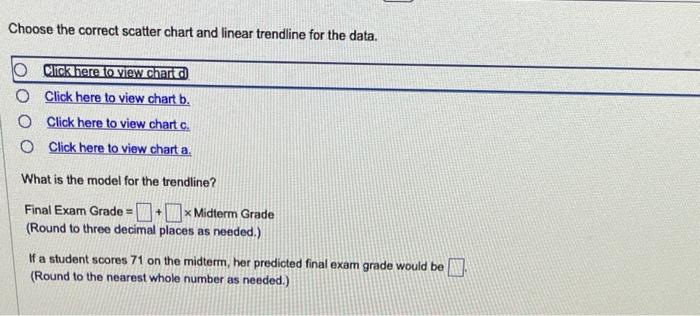 Using the accompanying Student Grades data, construct a scatter chart for midterm versus final exam grades and add a linear trendline. What is the model? If a student scores 71 on the midterm, what would you predict her grade on the final exam to be? Fi: Click the icon to view the Student Grades data. Student Grades Data Student Grades Data Chart a Choose the correct scatter chart and linear trendline for the data. Click here to view chartd Click here to view chart b. Click here to view chart c. Click here to view chart a. What is the model for the trendline? Final Exam Grade = + + Midterm Grade (Round to three decimal places as needed.) If a student scores 71 on the midterm, her predicted final exam grade would be (Round to the nearest whole number as needed.)
Step by Step Solution
There are 3 Steps involved in it
Step: 1

Get Instant Access to Expert-Tailored Solutions
See step-by-step solutions with expert insights and AI powered tools for academic success
Step: 2

Step: 3
Ace Your Homework with AI
Get the answers you need in no time with our AI-driven, step-by-step assistance
Get Started
Financial And Insurance Formulas
Authors: Tomas Cipra
2010th Edition
3790829013, 978-3790829013